
How has the Country Weighting of the MSCI ACWI developed over the last 10 years?
The MSCI ACWI (All Country World Index) is the flagship index of MSCI (Morgan Stanley Capital International). The index tracks the performance of large- and mid-cap stocks from 23 developed and 26 emerging markets, covering approximately 85% of market capitalization. The index is currently (April 2021) based on the stocks of approximately 3000 companies, making it one of the most diversified indexes investors can invest in via ETFs. [1]
Even more diversified among the MSCI indices is only the MSCI ACWI IMI (Investable Market Index), which includes small-cap stocks in addition to those of the MSCI ACWI. As the number of ETFs available for this index is very limited, many investors who want to have emerging markets in their portfolio as well as industrialized countries rely on the MSCI ACWI. The index is currently dominated by US companies, which have a share of over 57%, followed by Japan with almost 7%, China with over 4%, the UK with almost 4% and France with almost 3%. The remaining 44 countries combined only account for about 25%.
In this article, we shed light on how the weighting of countries in the MSCI ACWI has changed over the past decade. Has there been a rise in emerging markets from the Far East and Latin America? Has the weighting of the U.S. always been this high over the past decade? And how has Germany as a stock market location fared in an international comparison?
Data for the Country Weighting of the MSCI ACWI
Historical data on the price development of the MSCI ACWI can easily be found on the Internet (see Financial Data). However, if one is looking for data on the development of the positions in an MSCI index over time, these cannot be found easily. Usually, only data on the current composition of an index is available, for example in factsheets. In order to be able to examine the development of the country weighting of the MSCI ACWI over time, I have collected the factsheets of the last ten years. The data are available at monthly intervals from October 2011 to March 2021. As an example, Table 1 shows the first ten positions of the MSCI ACWI for October 2011.
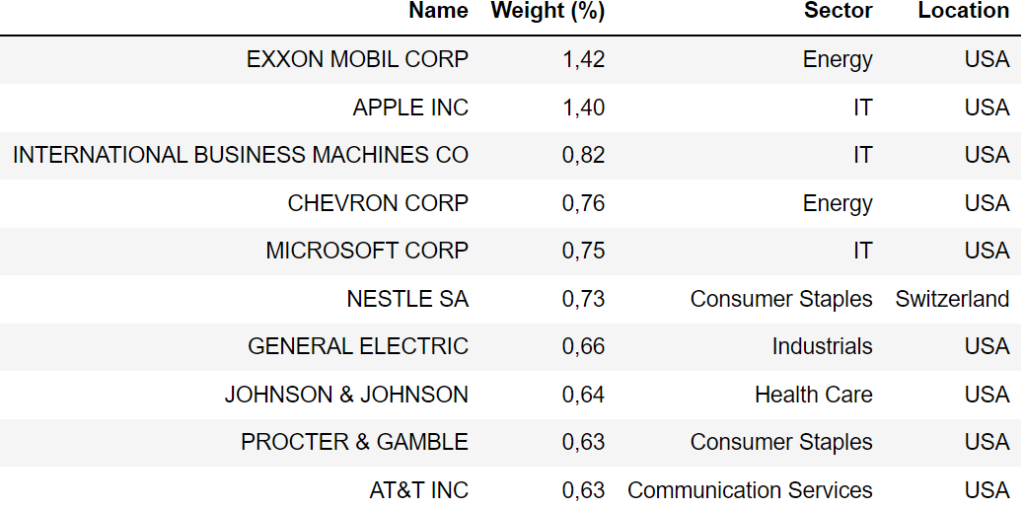
In addition to the names of the companies and the weighting in the MSCI ACWI, the data also contains information about the location. For each month, one can now add up the values for each location and obtain the following table.
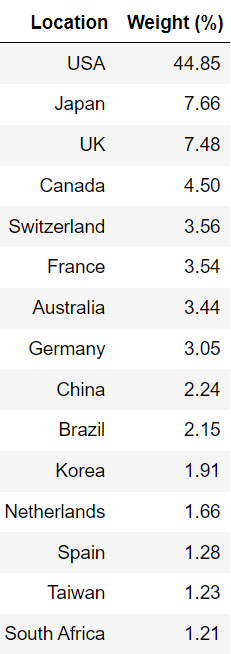
Table 2 shows the 15 countries with the largest weighting in the MSCI ACWI in October 2011. We can now perform this process for all months in the period from October 2011 to March 2021 and thus track the development of the country weighting over time. Another important note about the data is that it was taken from the factsheets of an ETF provider that tracks the index using optimized sampling. For this reason, there may be minimal deviations in the country weightings compared to the original index.
Analysis of the Development of the Country Weighting of the MSCI ACWI over Time
Figure 1 illustrates the development of the weighting over time for all countries as a line plot.
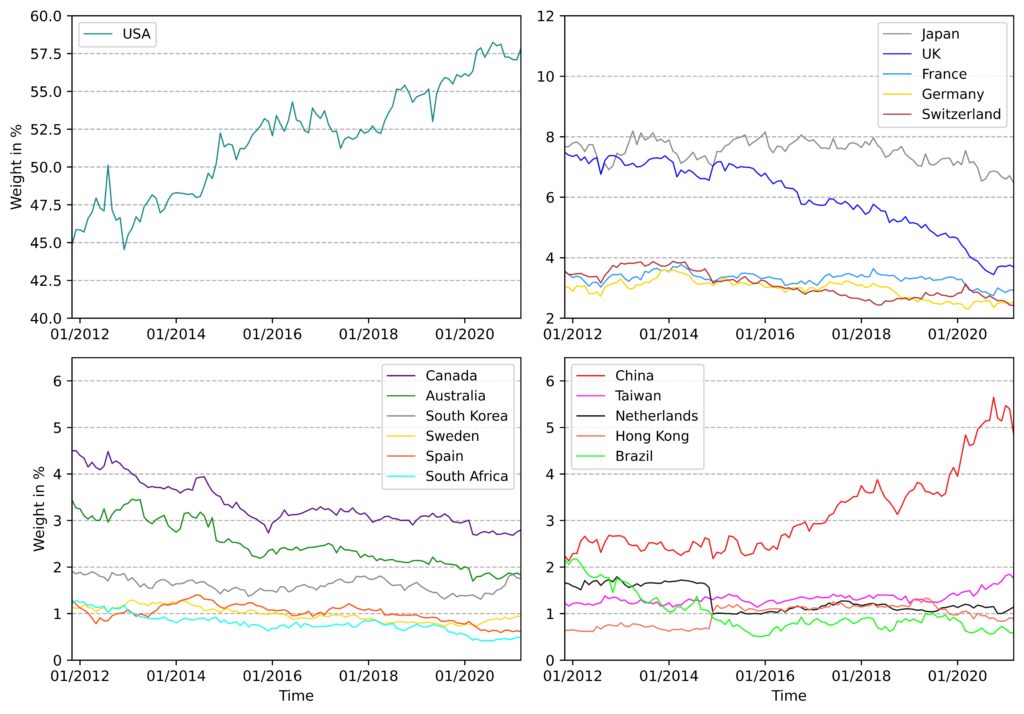
The figure shows that the USA has been the undisputed number 1 over the last ten years. The USA has been able to significantly increase its weighting steadily from the initial approx. 44.8% to the current approx. 57.8%. No other country has even been able to achieve a double-digit weighting. This increase is driven by the strong price gains of US tech stocks such as Apple, Microsoft, Alphabet, Facebook and Amazon. These companies currently account for more than 10% of the MSCI ACWI (to see how this rise in U.S. tech stocks has affected the top 10 stocks in the MSCI World, click here https://en.guidingdata.com/msci-world-top-10-positions).
The substantial increase in the weighting of the USA led to a reduction in the weighting of almost all other industrialized countries. Figure 2 illustrates this development. It shows the development of the weighting over time for all countries as a line plot. For all industrialized countries except Hong Kong, the lines point downward. In particular, the industrialized countries with initially high weightings, such as the UK, Canada, Japan and Australia, have suffered considerable losses.
Germany also suffered losses. The weighting decreased from 3.0% to 2.5%. The overall low weighting of Germany is also related to the fact that a large part of the economic power here lies in small and medium enterprises and these companies are generally not listed on the stock exchange. [2] In 2018, the market capitalization of all stock corporations in Germany was approximately 44% of the national gross domestic product and is thus significantly smaller than the global average of approximately 111%.
The development of the emerging markets looks different. With the exception of South Korea, all other Asian emerging markets managed to grow despite the strong increase in the USA. Brazil and South Africa, on the other hand, lost a great deal. The development of China is particularly remarkable. China more than doubled its share of the MSCI ACWI from 2.2% to 4.9%. Similar to the USA, the development in China was also characterized by the rise of large technology stocks such as Tencent and Alibaba. In addition to China, Taiwan was also able to significantly increase its share, driven by semiconductor manufacturer Taiwan Semiconductor Manufacturing, which is currently even represented in the top 10 of the MSCI ACWI.
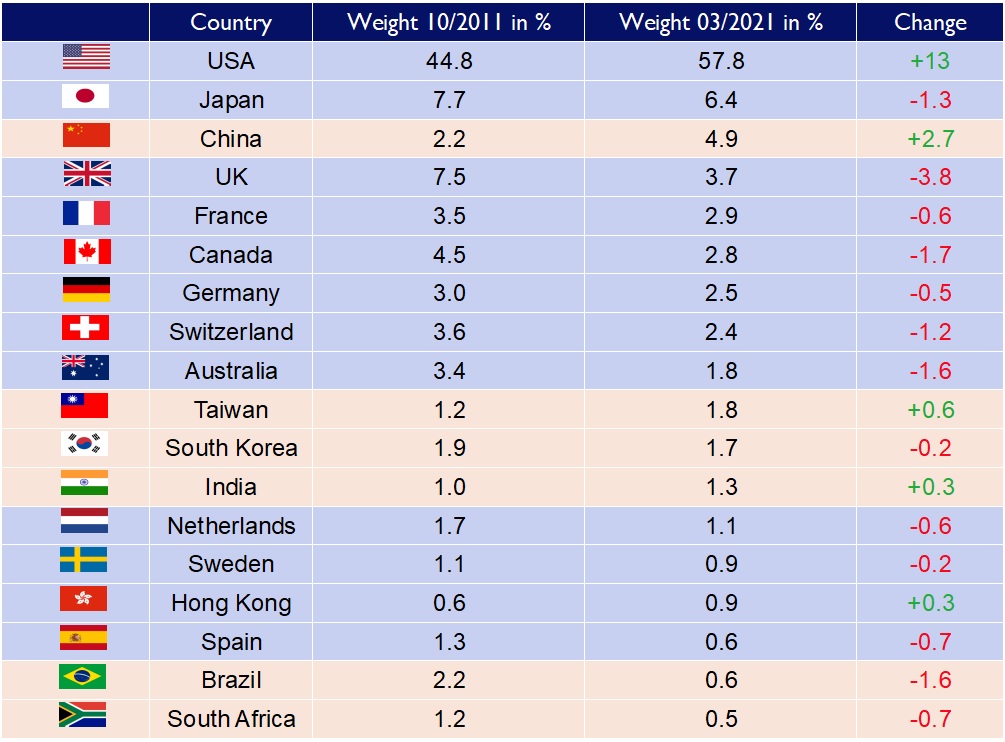
Table 3 lists all countries that have been in the top 15 over the last ten years, along with their weighting in 2011, their weighting in 2021 and the corresponding change.
Conclusion
- The last decade was characterized by a strong increase of the USA in the MSCI ACWI. The USA increased its share from 44.8% to 57.8% thanks to the strong performance of tech stocks.
- By contrast, all other Western industrialized countries represented in the top 15 suffered losses, some of them substantial.
- The Asian emerging markets, with the exception of South Korea, were able to increase their shares despite the increase in the USA. Especially China – the country more than doubled its weighting.
Sources
[1]: MSCI, https://www.msci.com/acwi
[2]: German Federal Ministry for Economic Affairs and Energy, https://www.bmwi.de/Redaktion/DE/Publikationen/Mittelstand/wirtschaftsmotor-mittelstand-zahlen-und-fakten-zu-den-deutschen-kmu.html (in German)