
How do REITs work and how do their returns compare to the overall stock market? Are they less susceptible to fluctuations than other stocks?
The desire to own a home has always been widespread. However, the sharp rise in real estate prices over the last decade, particularly in the urban centers, has made the dream a distant prospect for many. The decision to invest a large portion of one’s net worth in a single property is usually more of a lifestyle than a rational investment decision, where risk and return form the basis of the decision. But how can private investors who actually want to invest in real estate as an asset manage to do so, despite the high real estate prices, without having to bundle their entire assets by investing directly in a few properties and thus taking on a high cluster risk?
Probably the simplest and most transparent solution are so-called Real Estate Investment Trusts (REITs). In this article you will learn what REITs are and how you can invest in them with ETFs in a cost-effective and broadly diversified way. Furthermore, we will look at how the return and volatility of REITs compare to the overall stock market and how strongly REITs correlate with the rest of the stock market.
What are REITs?
REIT is an acronym for Real Estate Investment Trust. REITs originated in the USA and were developed in the 1960s. The aim was to create a transparent real estate investment modelled on equity funds, which would also offer small investors the opportunity to invest in real estate. REITs are listed stock corporations that generate their revenues from renting and leasing their own real estate and land, from interest profits and from profits on the sale of real estate. To make an investment, the investor must purchase shares of the REIT on the stock exchange.
One of the most important universal features of REITs compared to traditional listed real estate companies is the tax exemption at the corporate level. Profits are only taxed once they are paid out to shareholders as dividends. Thus, investors in REITs are in the same position as investors who have acquired real estate directly and also only have to pay tax on the profits from rental income.
To qualify for this tax exemption as a REIT, companies must meet various regulatory requirements. These requirements vary depending on the location. One universal requirement for REITs is that large portions of profits must be distributed directly to investors. The distribution ratio is around 90% in most countries. In addition, REITs are subject to certain restrictions in many countries. In Germany, for example, there is a comprehensive exclusion of residential properties, as REITs are not allowed to invest in residential properties built before 2006.
REITs are also present in globally diversified stock indices such as the MSCI World. In April 2021, there were around 66 REITs in the MSCI World, with the three largest positions AMERICAN TOWER CORP (0.18%), PROLOGIS (0.14%) and CROWN CASTLE INTL CORP (0.12%) based in the U.S., but some operating globally. [1] REITs are involved in a wide variety of real estate sectors. American Tower operates broadcast facilities for data transmission and communications, whereas Prologis is an operator and developer of logistics real estate.
Investors can invest exclusively in REITs with certain ETFs/indices which diversify across real estate sectors and countries. In this article, we will take a closer look at these REIT indices and examine how they perform compared to the overall stock market.
REIT Indices Data
Since REITs were not introduced in many countries until the turn of the millennium, only very limited historical data is available for many countries. In the U.S., on the other hand, REITs were introduced as early as 1960 and there is historical data dating back to the 1970s. For this reason, on the one hand, our analysis will be based on the U.S. market with sufficient historical data. On the other hand, we will additionally look at the data of a global REIT index for which data from the last decade is available and which contains REITs from both developed and emerging markets.
For the analysis of the US market, we will use data from the FTSE NAREIT All REITs in its total return form. This index contains REITs based in the US from every conceivable sector, from office buildings and residential properties to data centers and industrial real estate. It contains 223 positions and is weighted by market capitalization. [2] The index provider supplies data back to 1972 at monthly intervals. As a comparison we will use the MSCI USA in its total return form as a benchmark for the overall stock market.
For the global market, we will use the S&P Global REIT in its total return form. It contains a total of 428 REITs from industrialized and emerging countries. The focus is very much on the USA with a share of 65.9% (151 positions), followed by Japan with 9.1% (61 positions), Australia with 6.3% (31 positions), the UK with 5.3% (33 positions) and Singapore with 3.2% (34 positions). Germany is only represented with a weight of 0.2% and two positions. Data for the last decade is available for the S&P Global REIT Index at monthly intervals. As a benchmark for the global total stock market, we use the MSCI ACWI, also in its total return form.
For more information on where to get the data for the above indices, see Financial Data.
Analysis – REITs vs. Total Stock Market
FTSE NAREIT ALL REITs vs. MSCI USA
You can see the price trends for the FTSE NAREIT ALL REITs and the MSCI USA for the last 50 years in Figure 1. Except for a few short periods and a longer period from 1980 to 1987, the MSCI USA has always outperformed the REIT index. It is also worth noting that the REIT index suffered far greater losses than the overall stock market during most of the turbulent periods in the stock market, such as the oil crisis from 1973 to 1974, the Great Financial Crisis (triggered by a speculatively inflated real estate market in the U.S.) from 2007 to 2009, and also during the onset of the Corona Pandemic.
However, there was a long-lasting and drastic stock market crisis during which this behavior was exactly reversed: the bursting of the dotcom bubble in 2000. Within three years, the MSCI USA suffered losses of around 46%, whereas the REIT index increased by 48% during this period. The dotcom bubble was triggered by exaggerated profit expectations and speculation on rising share prices of tech companies without taking fundamental business indicators into account. The real estate industry, and thus also REITs, were not affected by the development of the bubble.
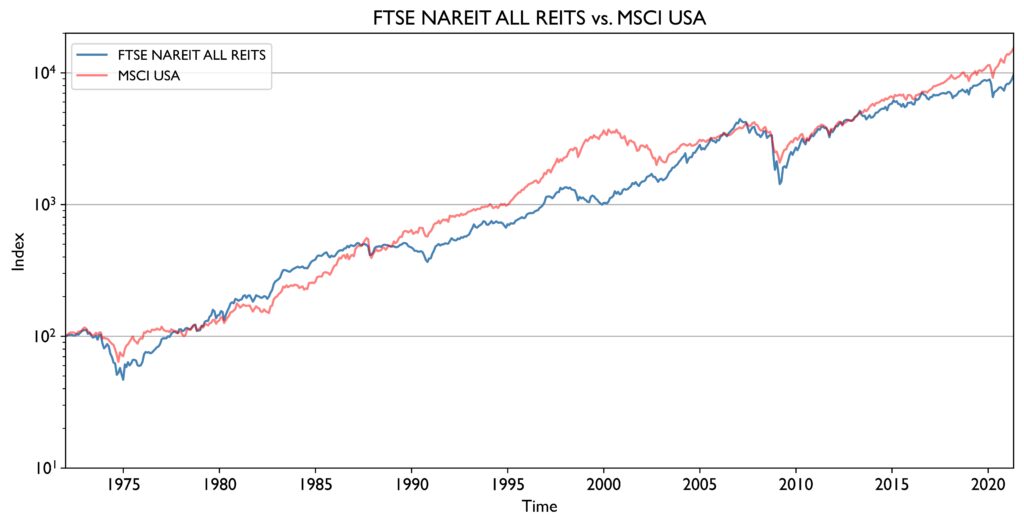
Figure 2 shows the monthly return distribution for the FTSE NAREIT ALL REITs and MSCI USA index. The distribution reveals that the REIT index has a discernibly larger variance than the MSCI USA, i.e. months with large losses or gains of up to about 30% are much more common for the REIT index. The annual standard deviation or volatility for the REIT index is 17.5%, while the one of MSCI USA is only 15.2%.
The REIT index is thus exposed to greater fluctuations than the overall stock market. This realization often comes as a surprise to many investors, as the value of real estate, and thus real estate companies, is generally considered to be much more stable than that of stocks.
The reason for underestimating the risk of real estate is the lack of information regarding the market price of a property. While in the stock market the value of each stock is updated virtually continuously by numerous market participants, each real estate property is unique and years or decades usually elapse between two transactions (purchase/sale) that reveal the market price. REITs and other publicly traded real estate companies provide a proxy for property value fluctuations.
You can find an interesting article on the actual risk of real estate investments on the blog of Gerd Kommer (in German), who also uses REIT indices to determine risk.
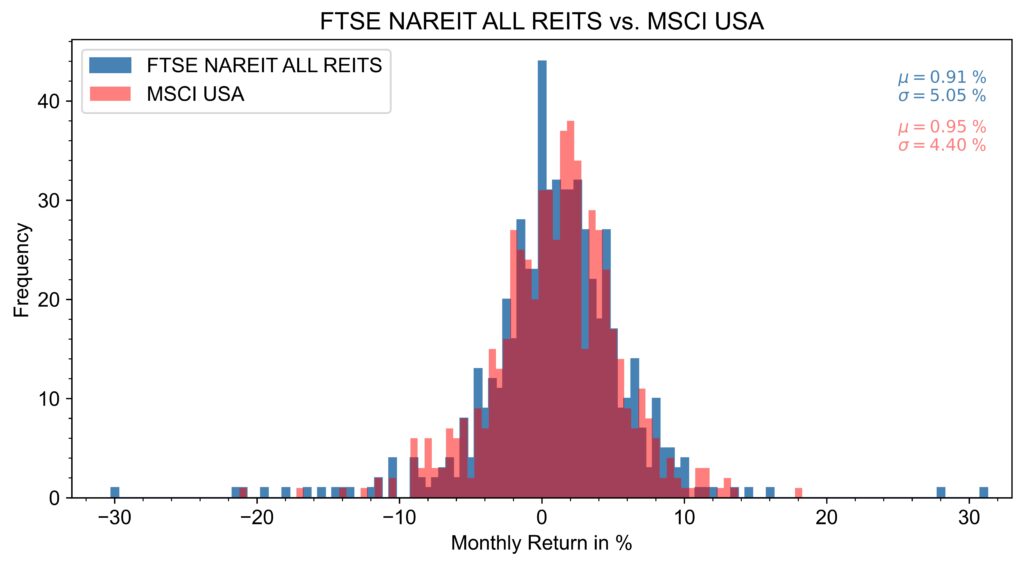
The total stock market also slightly outperforms the REIT index in terms of returns achieved, with an expected value for the monthly return of 0.95% or an annual return of 12.01%, in contrast to the REIT index with a monthly return of 0.91% or an annual return of 11.48%. The returns are not adjusted for inflation.
It is already clear from the price trends that the REIT index and the MSCI USA react similarly in many phases, but there are also exceptions such as the dotcom bubble, for example, where there was a contrary development. Therefore, in the following we will look at the correlation of the two indices to investigate whether it makes sense to add a REIT index to an equity portfolio to achieve lower overall volatility. Figure 3 shows the development of monthly returns over time for the last five decades. This illustration provides a clearer picture of the phases in which the two indices did not exhibit congruent behavior.
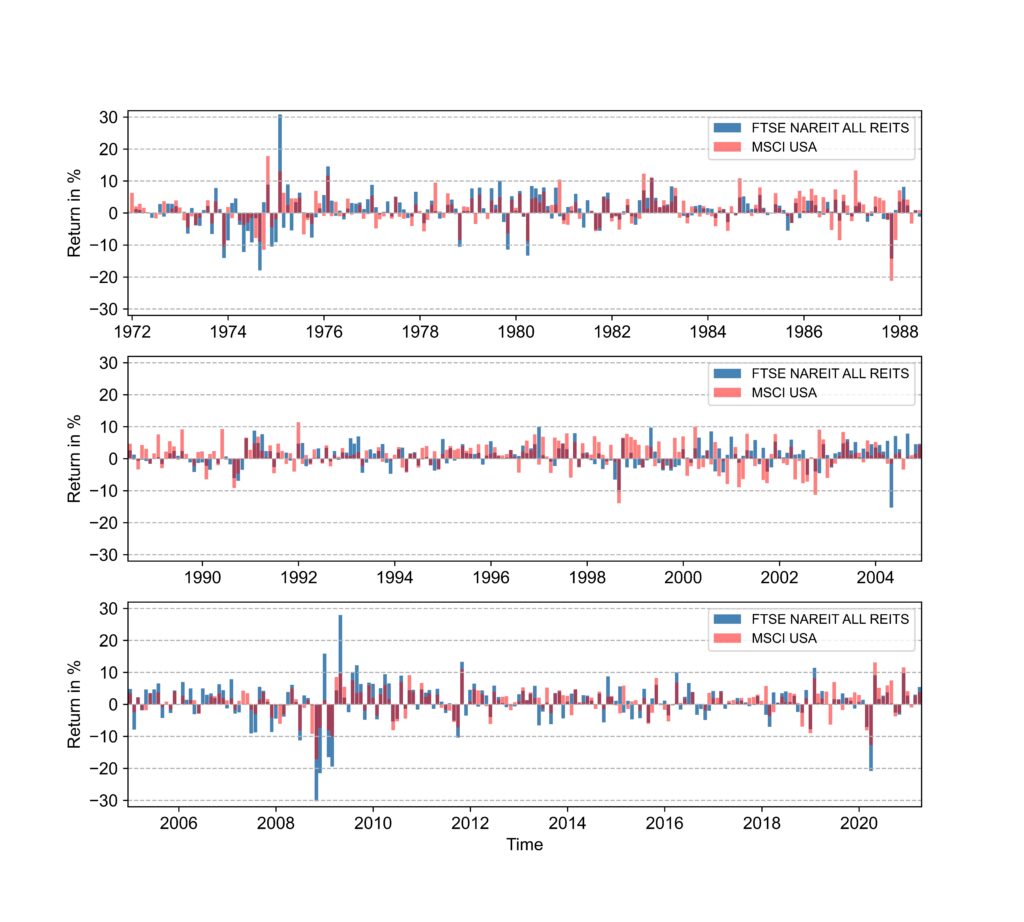
The correlation coefficient is a measure of the degree of linear relationship between two quantities. It can range from -1 to +1. With a value of +1, the two variables behave identically, with -1 completely opposite. If the correlation coefficient has the value 0, the two variables do not depend linearly on each other at all.
For the two indices, the correlation coefficient for the monthly returns for the total period is 0.60, i.e. there is a positive linear correlation. However, as the value is significantly below 1, it may make sense to add REIT indices to the portfolio for diversification reasons in order to achieve lower volatility overall.
Analysis – S&P Global REIT vs. MSCI ACWI
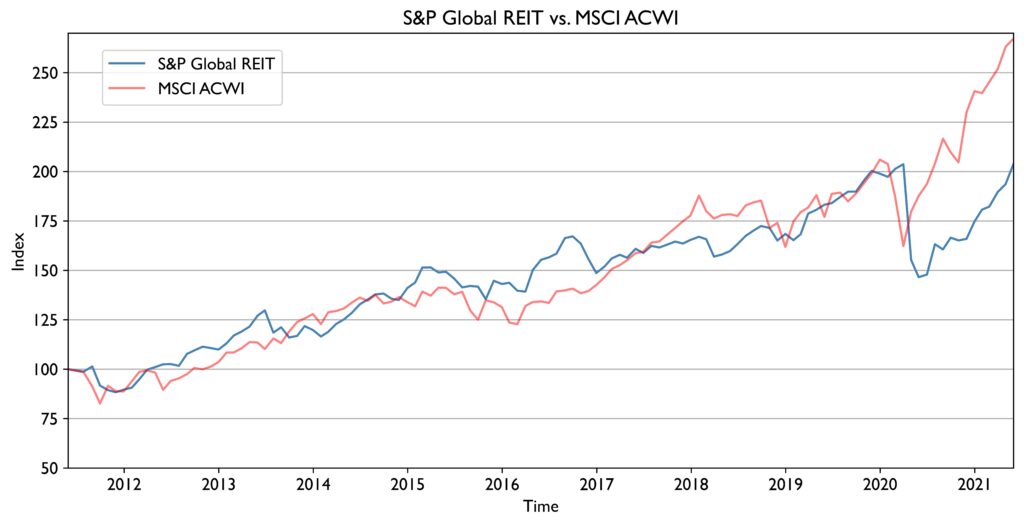
For the sake of completeness, we will also compare the global REIT index S&P Global REIT with the overall stock market in the following, even though data is only available for the last decade and the informative value is therefore limited. Figure 4 shows the price trends of the S&P Global REIT and MSCI ACWI. [3] After the crash in the wake of the Corona pandemic, the MSCI ACWI has delivered much better returns than the REIT index.
Looking at the distribution of monthly returns in Figure 5, one can recognize this superior performance. The expected value for the monthly return of 0.89%, or for the annual return of 11.12%, is significantly higher than that of the S&P Global Reit with a monthly return of 0.68%, or an annual return of 8.47%. However, the standard deviation is different. There, the REIT index with a monthly value of 3.72% or an annual value of 12.89% is below the overall stock market with a monthly value of 4.04% or an annual value of 14.00%.
However, as the period under consideration is very short, it can be expected that the global REIT index will also be more volatile than the overall stock market in the long term due to poorer diversification.
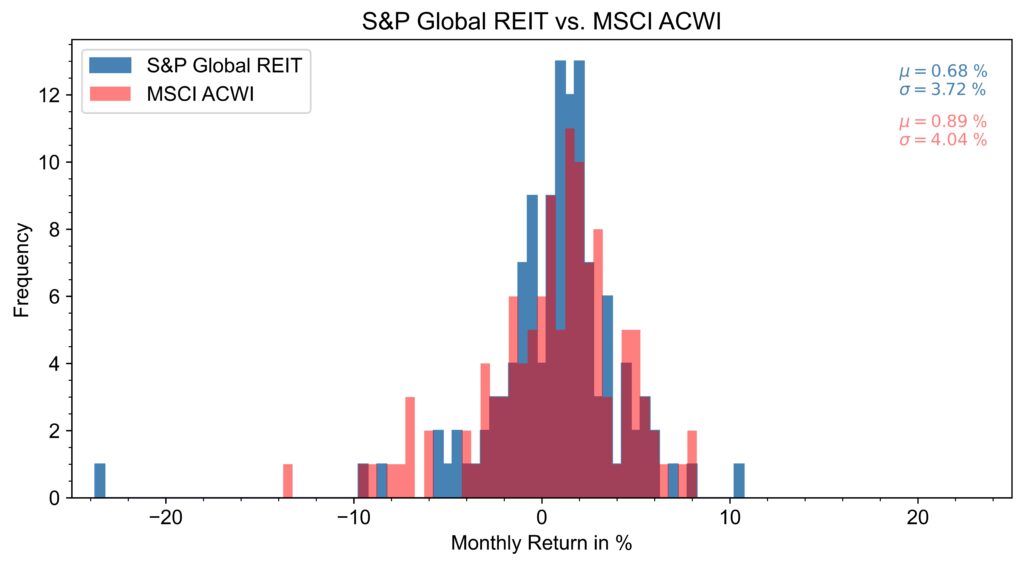
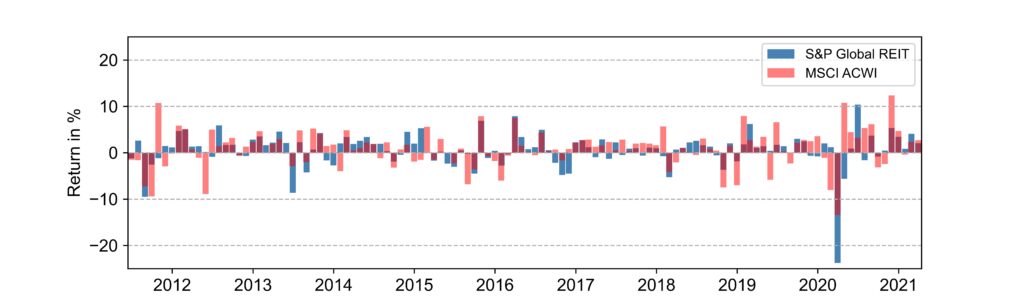
Figure 6 shows the development of monthly returns over time. The correlation coefficient for the global indices is 0.52, a similar value to the U.S. market.
Which ETFs track REIT indices?
An ETF that comes very close to the S&P Gloabl REIT is the iShares Global REIT ETF, but unfortunately it is only approved for distribution in the United States.
An alternative is the HSBC FTSE EPRA/NAREIT Development UCITS ETF (WKN: A1JCM0). Unlike the S&P Global REIT, however, it does not include REITs from emerging markets. There is also the iShares Developed Markets Property Yield UCITS ETF (WKN: A0LEW8), which also neglects emerging markets and includes other listed real estate companies (e.g. Vonovia SE) in addition to REITs. The total expense ratio of the two ETFs is quite high.
Conclusion
- The two REIT indices under consideration generate worse returns than the overall stock market. For the U.S. market, REITs exhibit higher volatility than the overall equity market. Contrary to what many investors assume, real estate does not necessarily offer a more stable performance than stocks. Rather, fluctuations go unnoticed because the market price of a property is revealed only at very irregular, long intervals.
- The correlation coefficient between REIT indices and the overall stock market is between 0.5 and 0.6. Especially during the bursting of the dotcom bubble, the U.S. REIT index FTSE NAREIT ALL REITs provided good protection against the speculative excesses in the high-tech sector. The relatively low correlation can be used to reduce overall volatility by overweighting real estate companies in the portfolio (by market capitalization, they currently account for only 2.65% of the MSCI ACWI).
Sources
[1]: MSCI, https://www.msci.com/constituents
[2]: Nareit, https://www.reit.com/data-research/reit-indexes/monthly-index-constituents
[3]: S&P, https://www.spglobal.com/spdji/en/indices/equity/sp-global-reit/#overview