
What does the 4% rule actually mean and how was it derived?
The 4% rule is probably the best-known withdrawal strategy, which many investors hope to use to generate endless passive income from their portfolio. The most common version of the 4% rule assumes that you can withdraw a maximum of 4% of your initial value from your portfolio each year without completely depleting it. Conversely, you need 25 times your annual expenses in portfolio value to be able to earn a living from your portfolio and achieve financial freedom this way. Because then 4% of the portfolio value corresponds exactly to your annual expenses.
In this post, we want to shed light on the scientific basis of this rule, the work of William Bengen and the so-called Trinity Study. In doing so, we will deal with the following questions:
- What risk is an investor exposed to during the withdrawal phase?
- What data are the studies based on?
- What was the composition of the portfolios considered?
- Is the 4% rule derived from the Trinity study really an efficient and safe withdrawal strategy?
- How does the probability for the survival of a retirement portfolio change as a function of the withdrawal rate?
Sequence of Return Risk
The volatility or susceptibility to fluctuation of equity investments plays the decisive role in the choice of a withdrawal strategy. Already William Bengen (1994) argued that pension plans based on averages are unrealistic due to the volatile nature of equities and inflation rates. [1] Indeed, if one assumes a constant increase with the historical average return of the global stock market, one could confidently take the higher average return from one’s portfolio. It is only the irregularity of the return sequence that leads to an unpredictable risk for withdrawal planning.
This risk is referred to as sequence of return risk. The specific sequence of fluctuating returns during the period under consideration has a high impact on the total return and thus also on the final value of a portfolio if funds are added or withdrawn over time.
The situation can be explained as follows: When a portfolio is depleted, the assets are at their highest at the beginning and become smaller over time. Since returns are always achieved in relation to the invested assets, returns achieved at the beginning have a greater impact on the final value than the returns achieved towards the end of the withdrawal phase.
During the savings phase, negative market cycles, such as after the Dotcom Bubble or the Great Financial Crisis, do not play a devastating role. On the contrary: during these cycles, investors can invest at favorable market prices. But for investors who have to liquidate their portfolios by necessity, e.g. because they use the income to make a living, such cycles can have a devastating impact on the survival of a retirement portfolio, especially if a negative market cycle starts at the beginning of the liquidation phase.
So how can you design a safe withdrawal from a retirement portfolio that contains stocks, and therefore will grow and shrink irregularly over time? One possible strategy is provided by the so-called Trinity Study, one of the most influential retirement planning papers in recent times. Published in 1998, the paper is named after the Trinity University in Texas, where the three academics that wrote the paper conducted their research.
Fundamentals of the Trinity Paper
The paper, called “Sustainable withdrawal rates from your retirement portfolio,” is freely available at the following link:
The Trinity study analysis is based on real data on monthly stock and bond returns from January 1926 through December 1997. Stock returns are based on the Standard & Poor’s 500 Index, which includes the 500 largest publicly traded companies in the United States. Corporate bond returns are monthly total returns calculated using the Salomon Brothers Long-Term High-Grade Corporate Bond Index and the monthly Standard & Poor’s High-Grade Corporate Composite Yield Index. The data are thus based exclusively on the U.S. market.
The authors used this data to determine the probability of a portfolio survival of 30 years as a function of the withdrawal rate. To do this, the 72-year period from 1926 to 1997 was divided into overlapping periods of 30 years, i.e. 1926 to 1956, 1927 to 1957, and so on. In total, there are 43 of these overlapping periods. In fact, the authors also considered shorter periods in the study, but we neglect them in this blog post.
For each of these periods, the performance of a portfolio was then calculated using the historical returns, with a monthly withdrawal amount from the portfolio corresponding to a percentage withdrawal rate of the initial value. For example, with an initial value of €100,000, a withdrawal rate of 4% results in a withdrawal amount of €4,000. In order to represent a realistic scenario, this value was adjusted to the annual development of inflation. A portfolio is classified as successful if it closes the withdrawal period after 30 years with a final value of zero or more.
The study considered portfolios of different compositions in terms of the ratio of stocks to corporate bonds, from an stock ratio of 0% to 100% in 25% intervals. In calculating the monthly portfolio returns, it is implicitly assumed that the portfolios are rebalanced each month to the desired allocation of stocks and bonds.
Results of the Trinity Paper
The result of the Trinity study is a matrix of success probabilities for different portfolio allocations. In addition to the famous 4% withdrawal rate, the authors calculated the probability of success for a variety of withdrawal rates. Figure 1 shows the success probabilities for withdrawal rates from 3% to 10% for different portfolio allocations.
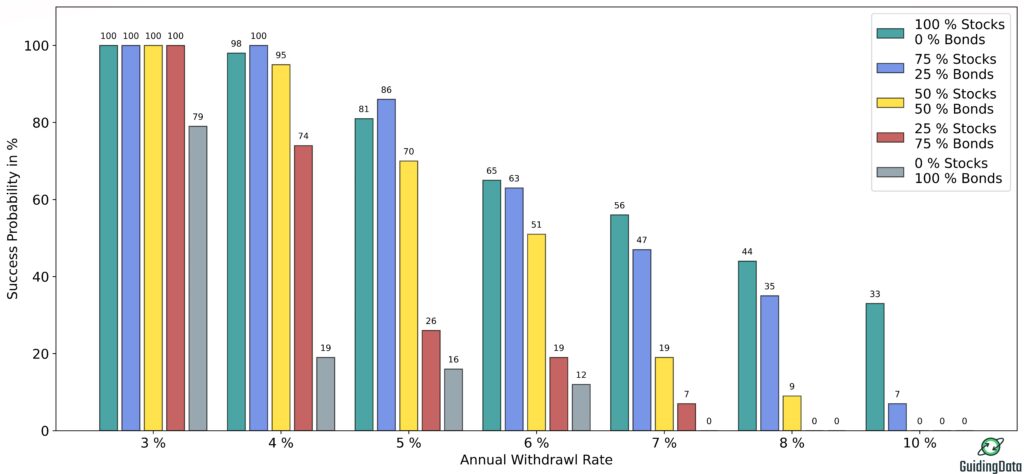
As expected, the probability of success decreases sharply as the withdrawal rate increases. While the success rate is still at 100% for all portfolios containing at least 25% of shares at a withdrawal rate of 3%, the success drops to 0% at a withdrawal rate of 10% for all portfolios containing less than 75% stocks. Furthermore, it is easy to see from the graph that high stock ratios of at least 75% have performed significantly better.
Even for a 4% withdrawal rate, there are portfolio allocations that have not always led to success in the past. For example, the 4% rule is based on the assumption that one has a stock ratio of at least 50%. Only then does the probability of success reach at least 95 %. Nevertheless, even for a withdrawal rate of 4% and a stock ratio of 50%, there were periods in the past when such a portfolio would not have reached a lifetime of 30 years. Only for a stock ratio of 75% was there no 30-year period in the time span considered that the portfolio would not have survived.
When looking at the Trinity study, the primary focus is on the 4% rule. However, the study also provides important insights to investors who are willing to be more aggressive in the withdrawal phase with the success probabilities given above. For example, if the investor is willing to live with a success probability of only 50%, the investor can increase the withdrawal rate to 6% or 7%, depending on the stock ratio.
Criticism of the Trinity Study
The Trinity study and the 4% rule derived from it have become widely known, especially by followers of the FIRE (financial independence, retire early) movement, who see it as proof that financial independence is attainable through passive income derived from equity investments.
However, there are some factors to consider when interpreting the results of the Trinity study:
- The Trinity study looks at market returns without taking costs and taxes into account. While investors can invest very cost-effectively today via passive products such as ETFs, tax considerations in particular can play a critical role in retirement planning.
- The data is based on the U.S. market alone, while many passive investors typically invest in the overall global equity market.
- Overall, there were only 43 30-year-time-periods in the time frame considered in the analysis. Moreover, these periods are not independent of each other, as they overlap. Estimates of success rates based on a small number of scenarios that even overlap are prone to significant errors in the rates. Nowadays, stochastic models (probability distribution of returns) can be used to generate an unlimited number of synthetic scenarios that can be used to determine success rates more accurately.
- The maximum length of the periods considered was 30 years. Followers of the FIRE movement who aim to retire at 40 or even 30 have a longer remaining average life span.
Sources
[1]: Jason S. Scott, William F. Sharpe and John G. Watson, The 4% Rule—At What Price?
[2]: Philip L. Cooley, Carl M. Hubbard and Daniel T. Walz, Trinity-Studie