
Which stocks have been in the Top 10 of the MSCI Emerging Markets over the past 15 years?
Emerging markets have always fueled investors’ fantasies. Either they are perceived as too risky and thus kept away from one’s own portfolio or they are overweighted as a supposed return booster. Some emerging Asian economies, such as China and South Korea, have recently managed to achieve domestic economic growth rates in the high single digits, at times even double digits. [1] With ETFs on indices such as the MSCI Emerging Markets (EM) or the MSCI ACWI, investors have the opportunity to add emerging markets to their portfolio at low cost in order to benefit from the dynamic economic development of emerging markets.
Nevertheless, investments in emerging markets are associated with higher risks than investments in industrialized countries. Many developments in the emerging economies are associated with greater fluctuations. This ranges from political stability, private consumption, inflation and the general economic growth. Consider last year’s story of Alibaba founder Jack Ma, who criticized China’s financial regulator in a speech and subsequently disappeared from the scene for months. Two weeks later, the financial regulator canceled the IPO of Alibaba’s financial subsidiary Ant Group just days before its planned initial listing. [2] The share price of the company, which at this point in time had a significant weighting of over 5% in the MSCI EM, suffered major losses and has not recovered to date.
In this blog post, we will look at the performance of the Top constituents in the MSCI EM. In addition to the individual constituents, we will also look at how much weight the Top 10, Top 20, Top 50 and Top 100 constituents account for and how the cluster risk has developed over time.
In many emerging markets, the economy is characterized by contrasts. On the one hand, vibrant metropolitan regions have emerged in recent decades, whose population and economic growth dwarf anything seen before and are home to some of the world’s most valuable tech companies. On the other hand, there are predominantly poor rural regions that live mainly from their mineral resources and agriculture. We will be able to observe how this development has affected the composition of the Top constituents in the MSCI EM in our analysis.
Symbolically, the post image shows the traditional rice fields near the Chinese metropolis of Shenzhen, whose skyline can be seen in the background. It is one of the most dynamic and richest cities in China and the headquarters of some of the most valuable companies in the world, including BYD, Tencent and Huawei.
MSCI Emerging Markets
The MSCI EM was launched by MSCI in 1988. The index started with ten countries, which at that time had a weight of about 0.9% of the MSCI ACWI. This is equivalent to a 0.9% share of the total global equity market excluding small caps and frontier market countries. Since its launch, the index has grown to 25 emerging markets, which currently account for 12% of the MSCI ACWI. From Russia to South Africa and from Brazil to Poland, emerging markets are spread across the globe. A list of all emerging markets in the MSCI EM can be found here.
In terms of GDP, the economic relevance of emerging markets is much greater than the share in the MSCI ACWI would suggest. The share of emerging markets in global GDP is steadily increasing. On a purchasing power-adjusted basis, China alone, with a 17.4% share of global GDP, has already surpassed the U.S. with 15.9% in 2019. [3]
Equities from the People’s Republic of China currently account for around 38% of the MSCI EM. This is followed by Taiwan with 15%, South Korea with 13%, India with 9% and Brazil with 5% (as of May 2021). Currently, the MSCI EM contains around 1391 positions and thus represents 85% of the market capitalization of the emerging markets.
Data on weighting in the MSCI EM
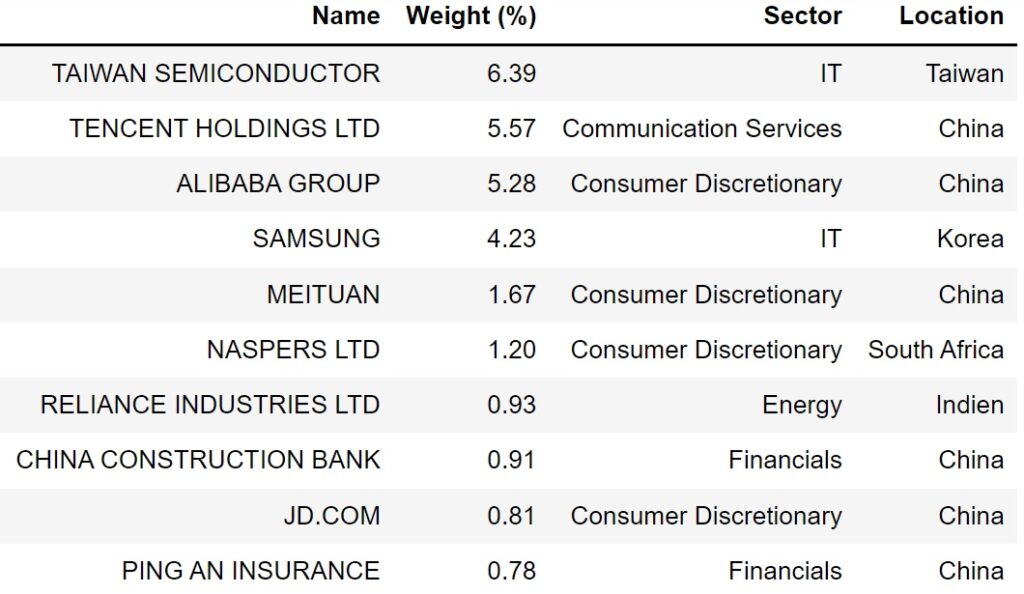
I have collected the data on the weighting of the individual stocks in the MSCI EM from the monthly factsheets. Since the data stems from the factsheets of an ETF with optimized sampling, there may be minor deviations compared to the original index. The data is available for the period from December 2006 to April 2021 at monthly intervals. In Table 1 you can see the data of the Top 10 stocks of the MSCI EM by weighting for April 2021 as an example.
Analysis – Development of the Top 10 constituents of the MSCI EM
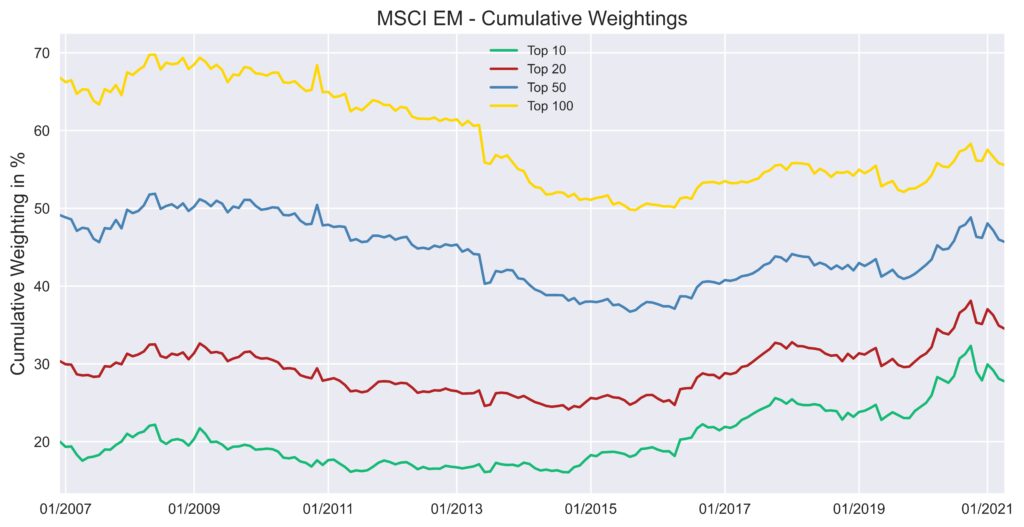
The time evolution of the composition of the top Top 10 constituents of the MSCI EM is shown in the following animation for the last 15 years. The values between the monthly intervals were interpolated linearly to achieve a smoother animation. Furthermore, Figure 1 shows the development of the cumulative weightings over time for the Top 10, 20, 50 and 100.
The animation reveals that there have been repeated changes in the composition of the Top 10 the MSCI EM over the past 15 years. In total, there were 36 companies represented in the Top 10. The majority of these companies are from China, followed by Brazil and India. The companies, together with their location and sector, can be found in Table 2 in the order in which they made it into the Top 10.
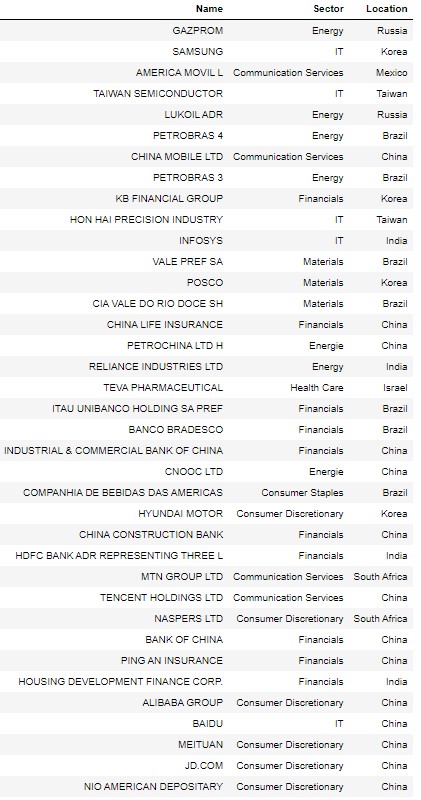
The order of the companies reveals that there have been fundamental distortions in the economic conditions in the emerging markets over the past 15 years. At the beginning, companies from the oil industry such as Gazprom, Petrobas or Lukoil as well as mining companies such as Vale were still very important for the MSCI EM. Over the last 15 years, this focus has shifted strongly towards the IT, Financials and Consumer Discretionary sectors. Whereas at the beginning Gazprom was the undisputed Number 1 with a weighting of over 4.5%, today tech companies such as Taiwan Semiconductor, Tencent and Alibaba dominate the index with over 5% each. Today, only one company from the oil industry remains in the Top 10, Reliance Industries from India.
It is also remarkable how extraordinarily high the weighting of individual companies in the MSCI EM is. If Apple’s weighting in the MSCI World was already considered high at around 4%, Alibaba’s weighting in the MSCI EM proves otherwise. The run on tech stocks during the Corona pandemic in October 2020 allowed Alibaba to reach an incredible 8.76% weighting.
Overall, the Top 10 of the MSCI EM have a very high cumulative weight. While the Top 10 of the MSCI World never accounted for more than 17% in the last ten years (see here), the value for the MSCI EM was over 30% in October 2020. Figure 1 reveals that these high weightings have only occurred in recent years. At the beginning of the period under review, the value was still around 20%. As with the MSCI World, the cluster risk has thus increased sharply in recent years. In particular, the run on tech stocks in the wake of the Corona pandemic has further accelerated this trend.
For the cumulative weight of the Top 100 positions, the development is reversed. While at the beginning the Top 100 positions were responsible for approx. 67% of the weighting, in 2021 it was only approx. 56%.
However, since emerging markets should only play a minor role in an investor’s portfolio, the high weighting of Alibaba and Co is put into perspective again. When Alibaba had a weighting of 8.76% in the MSCI EM in October 2020, the company only had a weighting of 1.14% in the MSCI ACWI (which includes industrialized countries as well) at the same time.
Conclusion
- In total, 36 different companies were part of the Top 10 of the MSCI EM in the last decade.
- In the beginning, the Top 10 included more companies from the oil industry, but today the focus is on tech companies.
- The cumulative weight of the Top 10 has increased significantly over the last 15 years.
- The cluster risk in the MSCI EM is thus much higher than in the MSCI World. However, emerging markets should only play a minor role in the portfolio due to their lower market capitalization when considering companies from industrialized countries as well.
You can find the same analysis for the Top 10 of the MSCI World here.
Sources
[1]: World Bank, https://data.worldbank.org/indicator/NY.GDP.MKTP.KD.ZG?locations=CN-KR
[2]: Zeit Online, https://www.zeit.de/wirtschaft/unternehmen/2021-04/jack-ma-alibaba-ant-group-china-internet-kartellamt-kommunistische-partei (German)
[3]: Statista, https://de.statista.com/statistik/daten/studie/248176/umfrage/anteil-wichtiger-industrie-und-schwellenlaender-am-globalen-bruttoinlandsprodukt-bip/ (German)