
How did the emerging markets index perform in 2021?
While we looked in detail at the annual performance of the MSCI World in the previous article, we will now take a closer look at the performance of the arguably most important emerging markets index, the MSCI Emerging Markets (EM), for the stock market year 2021. In line with the increasingly uncertain economic environment in the developed world, companies from emerging markets have also faced numerous challenges.
The wave of regulation in the technology sector in China, fears of new variants of the coronavirus, complications in global supply chains, and the crisis surrounding the highly indebted real estate giant Evergrande, which threatened to spill over into the international financial market – to name just a few of these challenges.
In contrast to the MSCI World, which reached several all-time highs at the end of the year despite many uncertainties and thus provided investors with strong price gains, the annual return of the MSCI EM is negative. In this article, we will examine which factors fueled this development and how the MSCI EM performed overall in 2021. In doing so, we will look at the following factors:
- Return distribution of the MSCI EM in 2021
- Development of the Top constituents
- Development of cumulative weighting of Top 10, Top 20, Top 50 and Top 100
- Development of sector weighting in 2021
- Development of country weighting in 2021
Price development of the MSCI EM for 2021
The MSCI EM recorded a negative return for the year 2021. Starting from an index value of 1292 points at the beginning of the year, the MSCI EM (price index excluding dividends) stood at 1232 points on the last day of the year. This corresponds to an annual return of -4.6%. The overall price development for the year 2021 is shown in Figure 1. The prices here correspond to the end-of-day prices. The data comes directly from MSCI. You can find more information here.
At the beginning of the year, the MSCI EM reached its longstanding all-time high, which it attained prior to the Great Financial Crisis in October 2007 at 1337 points. In January and February, the index reached a total of 14 all-time highs, the last for the time being on February 17 at 1445 points.
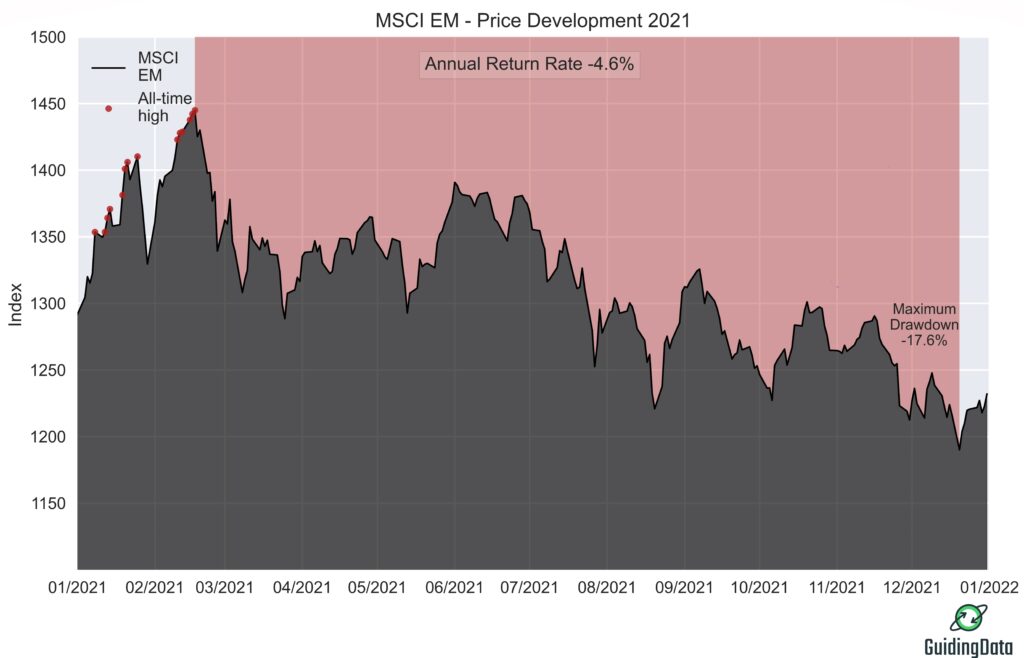
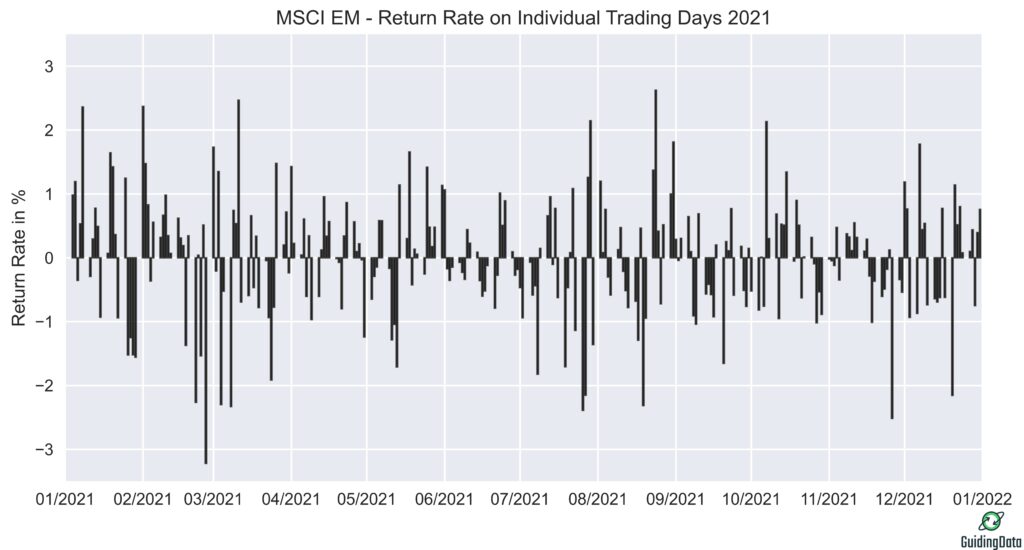
After reaching the last all-time high, the MSCI EM fell continuously except for a recovery phase in the summer. For this reason, the phase of maximum drawdown extends almost over the entire year, from the all-time high of 1445 points in February to December 20 with a loss of -17.6%. Figure 2 shows the returns of the individual trading days in 2021.
The main reason for the disappointing performance of the MSCI EM was the weakness of the Chinese stock market. The wave of regulation in the technology sector there caused severe price falls for big players in the MSCI EM such as Alibaba and Tencent. As China is the dominant country with a share of over 30% in the MSCI EM, these price setbacks also had a strong impact on the performance of the MSCI EM. In contrast, the stock markets of other emerging markets such as India and Taiwan recorded strong price gains in the past year.
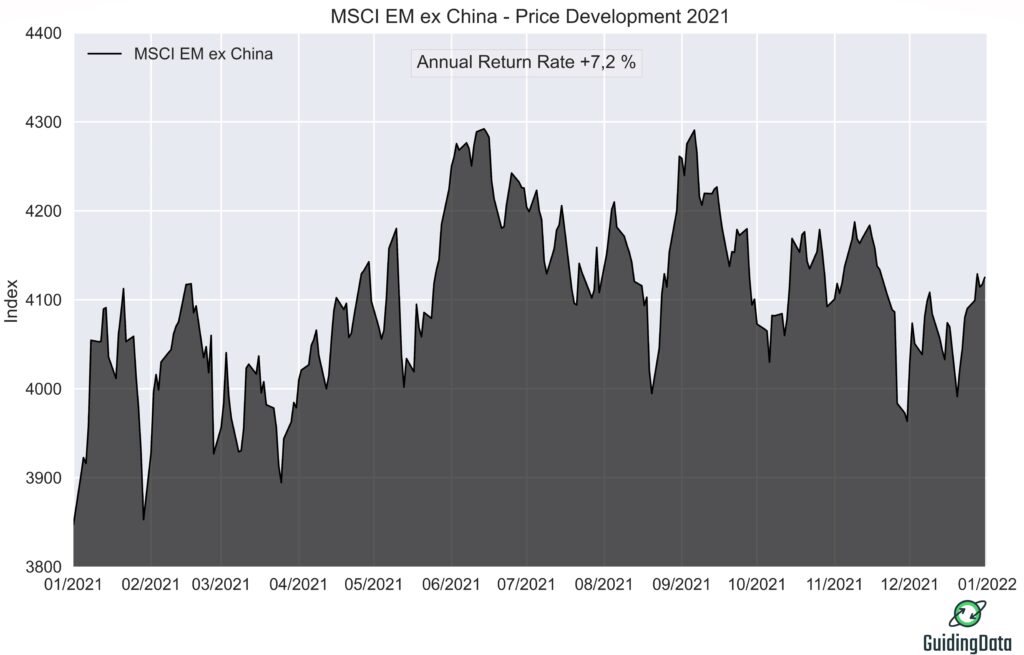
In addition to the MSCI EM, MSCI also issues the MSCI EM ex China index. This index includes all emerging markets with the exception of China. The price performance of the MSCI EM ex China for 2021 is shown in Figure 3. Excluding China, the remaining emerging markets achieved a positive return of 7.2%. Although this figure is also much lower than the annual return of 20.1% for the MSCI World, it shows that it was primarily the weakness of the Chinese stock market that was responsible for the negative return of the MSCI EM.
MSCI EM – Return distribution for 2021
Figure 4 shows the daily return distribution of the MSCI EM for the year 2021. The arithmetic mean of the returns is -0.014% and the daily volatility is 0.9%. This corresponds to an annual volatility of 15.1%. The price swings were thus much more pronounced for the MSCI EM than for the MSCI World, which recorded a value of only 11.3%.
The price of the MSCI EM was reported by MSCI on 260 trading days. Of these, 136 recorded a positive return and 124 a negative return. The return distribution for 2021 shows the overweighting (fat tail) of high negative returns typical of stock returns. The highest daily return was recorded on August 24 at 2.6% and the lowest on February 26 at -3.2%.

Development of the Top 20 constituents of the MSCI EM in 2021
In the beginning of the history of the index, the top positions were mainly held by oil and commodity companies. Nowadays the index is dominated by technology companies. In 2021, Chinese companies from the technology sector such as Alibaba, Tencent, Meituan, JD.com and Baidu etc. played a decisive role. This time, however, a different one than in previous years.
Since the government in Beijing started to regulate the powerful tech companies to a considerable extent, the shares have gone downhill. The regulations range from limiting consumer’s access to online games, to huge fines of billions of dollars for market abuse, to blocking planned IPOs. [1][2] For example, Tencent, China’s largest gaming and social media company, lost about 20% of its stock market value within a few days when the Beijing government declared online games to be “spiritual opium”.
As many of these companies are among the most valuable in the emerging markets, these price declines also had a significant impact on the composition of the top positions in the MSCI EM. Figure 5 shows the Top 20 constituents and their weightings at the beginning and end of the year.
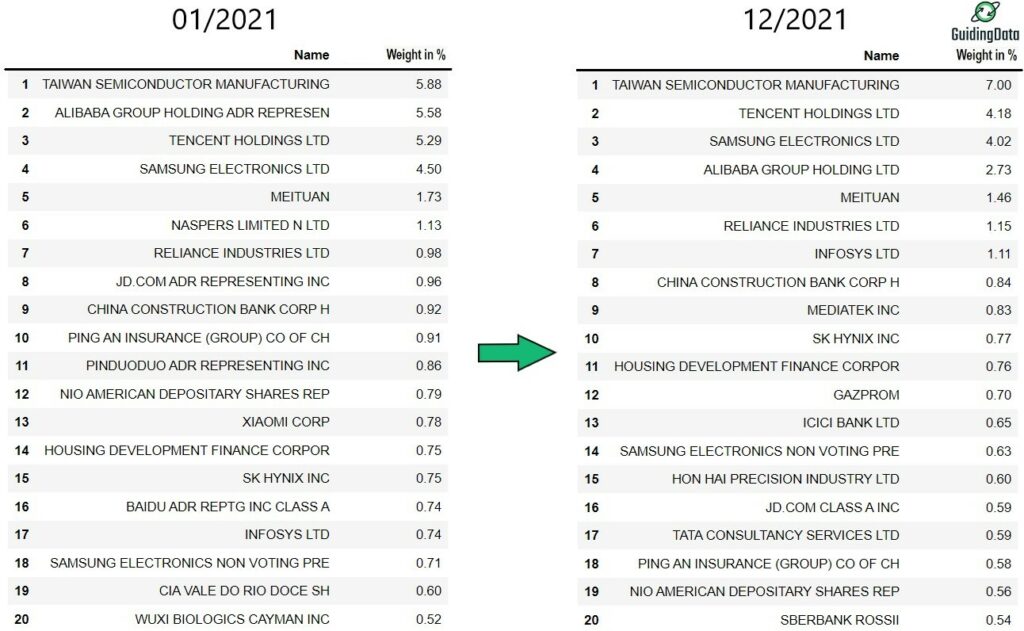
The figure reveals that the Chinese tech giants Alibaba, Tencent, Meituan, JD.com and Baidu, which were all represented in the Top 10 of the MSCI EM at the beginning of the year, have lost considerable weighting. Foremost among them was Alibaba, whose weighting in the MSCI EM crashed from 5.6% to 2.7%. All of these companies lost at least one-fifth of their market capitalization in 2021:
- Alibaba -49.0%
- Baidu -31.1%
- Meituan -24.0%
- JD.com -22.3%
- Tencent -19.8% [3]
Development of cumulative weighting of the Top 10, Top 20, Top 50 and Top 100 of the MSCI EM
Over the past 10 years, the cumulative weight of the Top 10 has increased sharply due to the rise of Chinese tech groups, even exceeding 30% in 2020. In 2021, this trend has reversed. Figure 6 shows the development for the year 2021. The fall in the share prices of Chinese tech companies has led to a decrease in the cumulative weightings. For example, the share of the Top 10 constituents decreased from 27.9% to 24.1%. Likewise, the cumulative weighting of the Top 100 decreased from 56.1% to 52.7%.

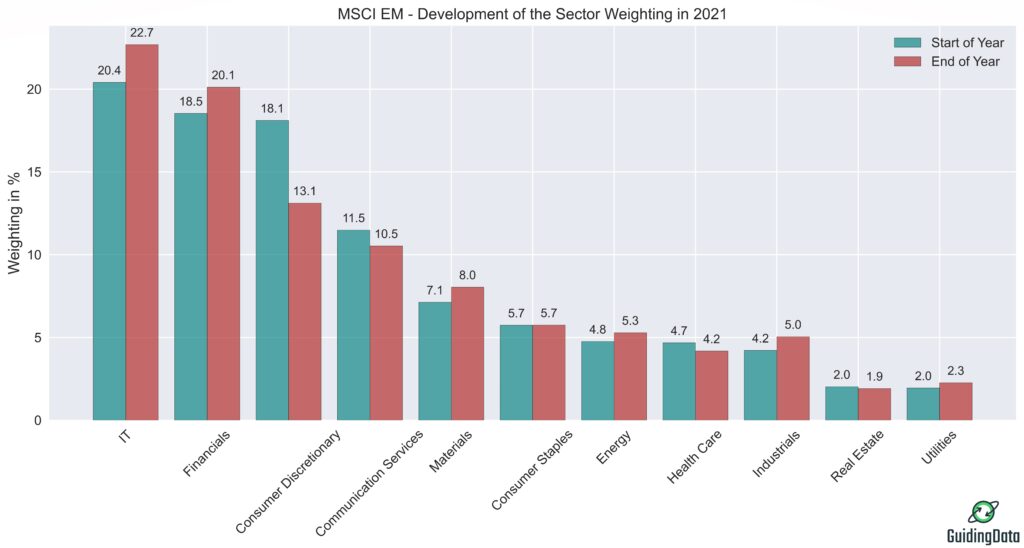
Development of sector weighting of the MSCI EM in 2021
Despite the wave of regulation on Chinese tech companies, the IT sector was able to further expand its high share and stood at 22.7% at the end of the year. This is due to the fact that many of the companies affected by the regulations are not assigned to the IT sector. The big losers Alibaba, Meituan and JD.com are assigned to the consumer discretionary sector and Tencent and Baidu to the communications sector. Figure 7 shows that both sectors have lost significantly, with the consumer discretionary sector in particular losing a substantial 5 percentage points in weighting.
Development of the country weighting of the MSCI EM in 2021
Figure 8 shows the development of the weighting of the Top 15 countries in the MSCI EM. China remains the dominant country. Nevertheless, it lost a lot of weight in 2021. The main cause was stricter regulation of major tech companies, which caused China’s weighting to collapse from 39.0% to 32.0%. Among the big winners were Taiwan and India, which together now account for nearly 30% of the MSCI EM. Due to the strong increase in fossil fuel prices, Russia and Saudi Arabia also recorded high gains with their energy conglomerates.
In contrast to the MSCI World, where the focus on the USA has increased further with a weighting of almost 70%, the 2021 stock market year brought about a more balanced weighting by country in the case of the MSCI EM.
In addition, the MSCI EM was affected by a revision at country level in November 2021. MSCI no longer classifies Argentina as an emerging market but as a “standalone market” since that date, as accessibility to the country’s equity market has deteriorated. [5] The Argentine stock market at this time only had a small share of about 0.18% of the MSCI EM.

Conclusion MSCI EM 2021
- The MSCI EM delivered a disappointing performance in 2021 with an annual return of -4.6%.
- The maximum drawdown was 17.6%.
- The weakness of the MSCI EM is largely related to the wave of regulation in China. Many of the top Chinese companies lost significant value in 2021.
- In contrast, other emerging markets such as Taiwan and India performed well. This can also be seen in the MSCI EM ex China, which includes all emerging markets except China. This index gained 7.2% over the year.
Sources
[1]: Fortune, The year since Beijing canceled the world’s biggest IPO is proof that the golden era of Chinese listings is gone for good
[2]: New York Times, China Fines Alibaba $2.8 Billion in Landmark Antitrust Case
[3]: Yahoo Finance, https://finance.yahoo.com
[4]: BBC, Why is there a chip shortage?
[5]: MSCI, MSCI 2021 Market Classification Review