
How have the Top 10 positions in the MSCI World developed over the last 10 years?
For many investors, the MSCI World is the base index for their ETF portfolio. It tracks the development of the stock market in 23 industrialized countries, contains about 1600 companies and comprises about 85% of the market capitalization. In this blog post, we look at the spearhead of the MSCI World, the Top 10 positions by weight in the index, and thus the most valuable companies in the industrialized countries. The MSCI World Index weights companies by their market capitalization (market value). As this is subject to daily fluctuations on the stock market, the weight with which the companies are represented in the index also fluctuates.
We look at the development over the last ten years: Which companies were featured, when were they featured, how heavily were they weighted, and has the cluster risk in the MSCI World increased over time?
Data of the composition of the MSCI World
To examine the performance of the Top 10 positions in the MSCI World, I collected data from the MSCI World factsheets. The data was available at monthly intervals from January 2011 to the present time (March 2021) and includes all positions in the MSCI World. Thus, we have information on the composition of the MSCI World for the past 123 months.
In addition to the weighting, the data also contain information on the industry and the domicile of the companies. Table 1 shows an example of the data for the current (as of March 2021) Top 10 positions of the MSCI World.
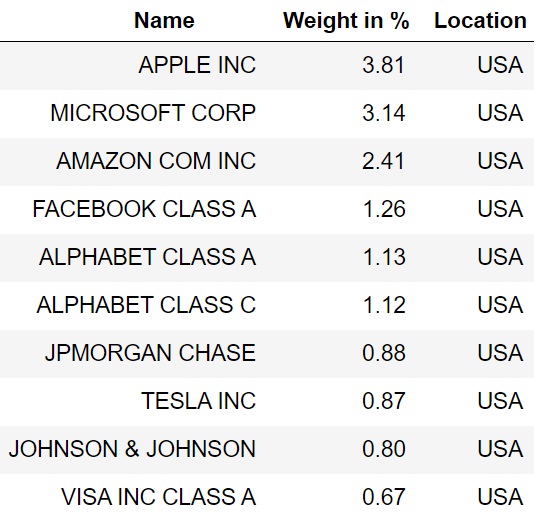
The table already indicates that the development of the MSCI World depends to a large extent on US companies (currently, US companies account for approx. 66% of the index). [1] In addition, tech companies such as Apple, Microsoft, Amazon and Alphabet (parent company of Google, appears twice in the table with different share classes) currently have a particularly strong influence on events. But has that always been the case over the past decade?
Analysis of the evolution over time of the Top positions in the MSCI World
Animation of the time evolution of the Top 10
In order to be able to take a closer look at the development over time, you will find below an animation of the composition of the Top 10 of the MSCI World for the last ten years. The animation shows a bar chart according to the weightings of the companies and is updated in monthly steps. In addition to the weights of the individual positions, the development of the cumulative weight of the Top 10 positions over time is shown.
The animation reveals that the MSCI World Top 10 has by no means been static over the past ten years, but has seen a lively exchange. A total of 25 companies have been awarded the title of “Top 10 Member” over the past decade. For a better overview, these 25 companies are listed again in Table 2 together with their current weighting.
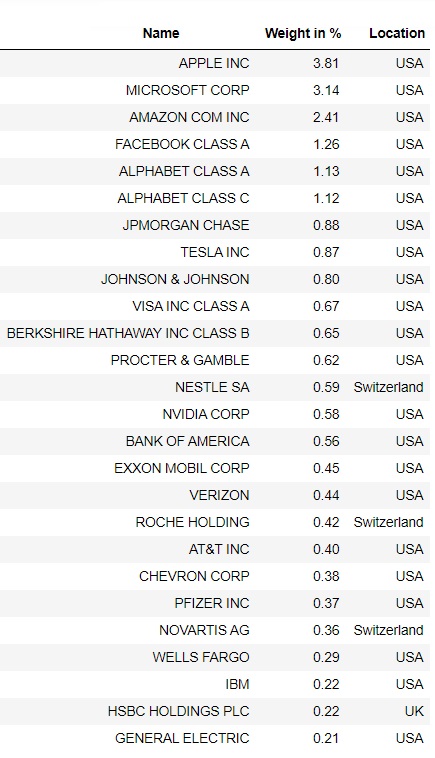
At the beginning of the period, more traditional companies, including those from the oil industry, appeared in the Top 10, e.g. ExxonMobil at No. 1, General Electric, Chevron, HSBC, Protector & Gamble and Nestle. Apple and Microsoft were also represented, but with a much smaller weight than today. In today’s Top 10, by contrast, the major tech corporations from the U.S. occupy a dominant role. Apple, Microsoft, Amazon, Alphabet and Facebook now occupy the top ranks and account for almost 13% of the MSCI World. The rise of tech stocks has accelerated significantly with the Corona pandemic in 2020.
The same trend can also be seen in the development of the sector weighting of the MSCI World which we examined for the last ten years in this post.
Table 2 also shows that with the exception of three companies from tiny Switzerland and HSBC from the UK, all of the Top 10 positions over the past decade have come from the US.
How the country weighting has developed in the past for the MSCI ACWI, can be found here.
Has the MSCI World’s cluster risk increased?
In the following section, we examine the cumulative weight of the top positions in the MSCI World in order to assess whether the cluster risk has increased. By cluster risk, in the context of stock indices, I mean the risk that arises when the performance of an index is significantly dominated by a small number of companies.
In addition to the cumulative weight of the Top 10, which was already shown in the animation above, we will also look at the development over time of the cumulative weights of the Top 20, Top 50 and Top 100 positions of the MSCI World. These are shown in Figure 1.

Figure 1 illustrates clearly that the cluster risk in the MSCI World has increased over the last ten years. Whereas in January 2011 only around 9% of the weight was combined in the Top 10, today it is around 16%. For the Top 100, the figure has risen by around 5 percentage points. In total, the Top 100 companies currently account for 45% of the MSCI World. As a reminder, the entire index comprises around 1600 companies, i.e. around 6% of the companies account for almost half of the index. The trend towards a concentration of weight in the top positions was further accelerated in 2020 by the run on tech stocks during the Corona pandemic. Time will tell if this is just a momentary outlier or if the trend will continue.
How can investors respond to this increasing cluster risk in the MSCI World over the past few years? In my view, it can make sense to add an ETF on the MSCI EM or MSCI EM IMI (also contains small cap stocks) to the portfolio or to replace the MSCI World with the MSCI ACWI. Both options add emerging market stocks to the portfolio and thus moderate the strong weighting of the Top 10 of the MSCI World (currently tech stocks). It also reduces the proportion of U.S. companies in the overall portfolio.
Another option would be to include factors such as small cap stocks (companies with small market capitalization) or value stocks (cheaply valued stocks). This can be achieved for example with ETFs on the MSCI World Small Cap and MSCI World Value. In general, it should be understood that if you only have the MSCI World and MSCI EM in your portfolio, you are not practicing strictly market neutral investing. The simple reason is that in such a portfolio companies with small market capitalization are completely neglected, although they have performed better than the overall market in the past (small cap effect).
Conclusion – How has the clustering developed in the MSCI World?
- In total, 25 different companies have been part of the MSCI World Top 10 over the past decade.
- In the last decade, more tech companies have entered the Top 10.
- The cumulative weight of the Top 10, Top 20, Top 50 and Top 100 has increased sharply in recent years, i.e. a small number of companies increasingly determine the price development of the MSCI World. Thus, the cluster risk has increased.
- To reduce the high weighting of individual positions, it is possible to add other indices to the portfolio. Possibilities would be to include the MSCI EM and thus shares from emerging markets or to overweight factors such as value or small cap.
It was clear to me before writing the article that the largest positions in the MSCI World account for a large part of the weight. However, I would not have thought that this concentration has accelerated so much in recent years. I was also surprised by which companies were already in the Top 10. Would you have thought that the concentration of weight in the top positions of the MSCI World has increased so much in recent years? And which members of the Top 10 surprised you?
If you are interested in the performance of the MSCI World for the year 2021, you can find a detailed annual review here.
And if you are interested in the same analysis for the Top 10 of the MSCI Emerging Markets, you can find it here.
Sources
[1]: MSCI, https://www.msci.com/equity-fact-sheet-search search for MSCI World