
Do all-time highs provide a suitable indicator for assessing the stock market?
The hysteria of the all-time high is widespread in the financial media and unsettles investors. For years, stock markets have gone from all-time high to all-time high, and cries that stock markets are grossly overvalued are a constant companion. Graphical illustrations such as the price trend of the MSCI World in Figure 1 are often used to underpin the overvaluation of stocks. But is the occurrence of an all-time high a suitable indicator to assess the situation on the stock market at all, and should investors really base their investment decisions on it?

What data will we use?
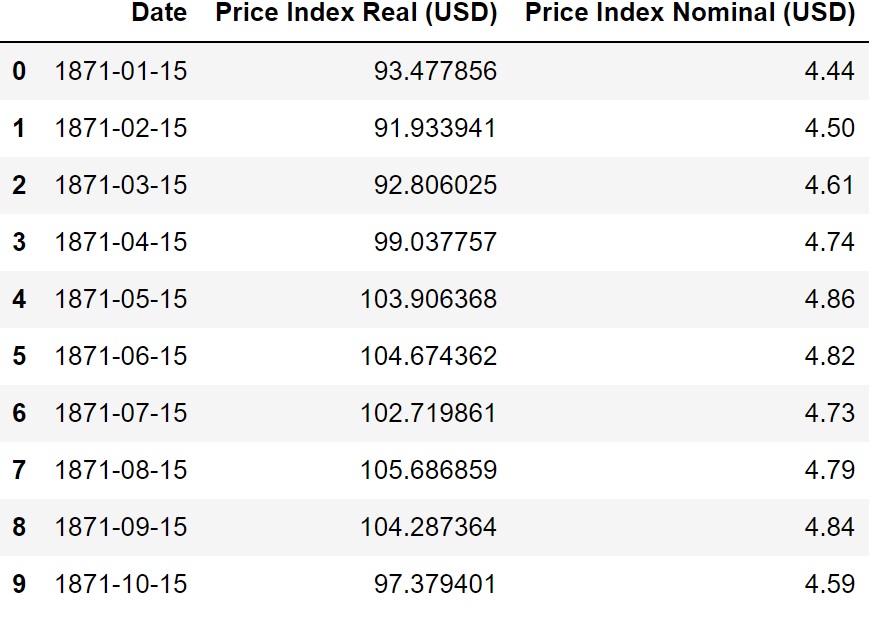
We use two different data sets to answer the question about the relevance of all-time highs: Robert Shiller’s data and MSCI World data. The Shiller data covers the performance of the S&P 500 from 1871 to the present. This is the longest period for which data is available on any stock market. The S&P 500 tracks the performance of the 500 largest publicly traded U.S. companies. Moreover, the Shiller data includes inflation-adjusted values in addition to nominal values, hence we can examine the impact of inflation on the frequency of all-time highs. We will use the price-only index, excluding dividends. Table 1 shows the first ten measurement points of the Shiller data. The measurement points are recorded at monthly intervals.
We do not only look at the US stock market, but at the nominal price development of the MSCI World over the last 50 years as well. It covers the development of the stock market in 23 industrialized countries and tracks around 85% of stocks by market capitalization. We also use the price index without dividends here. Unfortunately, inflation-adjusted values are not available for the MSCI World. The first ten measurement points for the MSCI World can be seen in Table 2. The measurement points are recorded at monthly intervals.

You can find further information and how to find the Shiller data and the MSCI World data here: Financial Data.
Analysis of the all-time highs in the MSCI World and S&P 500
In order to answer the question about the relevance of all-time highs, we will examine three factors: the frequency and the time intervals between all-time highs as well as the average returns after reaching an all-time high (here we will refer to Gerd Kommer’s blog, a German expert on stock market research). We will also examine the impact of inflation on the frequency of stock market records.
First, let’s go back to Figure 1, which shows the price trend of the MSCI World. Indeed, in this plot, the increase in price seems to be accelerating. In absolute terms, this is true. But we have to look at the percentage increase and not the absolute one.
After all, an investor will not care whether his assets double at a price of USD 100 or USD 1000. What matters are the percentage changes and these are not adequately represented in a linear price scale as in Figure 1, because the absolute index value for recent times is much higher due to the compound interest effect. Therefore, in the linear representation, it looks as if the prices practically did not move at all until the 1980s, followed by an explosion starting in the 1990s.
This misleading effect can be eliminated by using a logarithmic plot. With this scale, the distances for identical percentage changes in the chart are equal in each case. Figure 2 therefore shows the Shiller data and MSCI World data with a logarithmic price scale. Additionally to the price developments, all all-time highs of the respective index are noted in red dots.
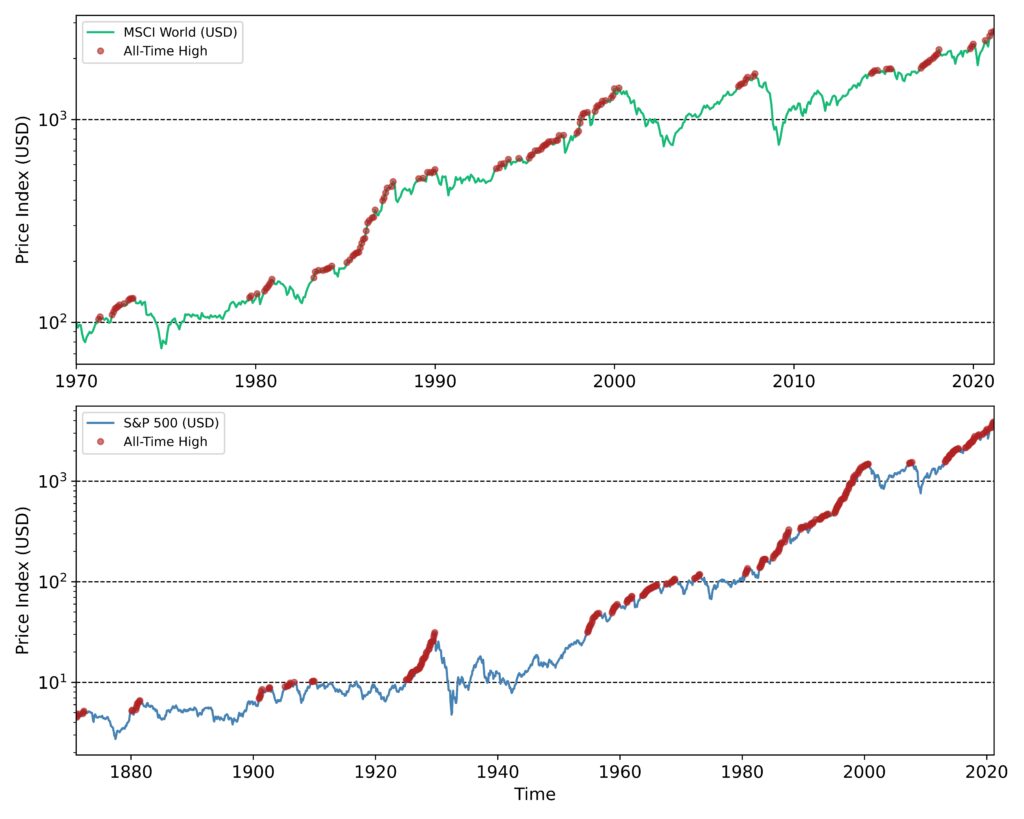
In some cases, the individual points are indistinguishable because the highs follow one another at short intervals. In the 1803 months of Shiller data, there are a total of 302 all-time highs. This corresponds to a share of 16.7%. In the MSCI World, the occurrence is even more frequent; out of 615 months, 133 months set a new all-time high. That’s a whopping 21.6%.
The figure demonstrates that all-time highs are by no means a peculiarity but rather the rule. If we recall the results of the blog entry Returns of Stock Shares and ETFs over the last 50 years, we know that returns for stocks follow a probability distribution with a positive expected value, i.e., average returns are positive. For this trivial reason, the stock market tends to go up in the long run and reaching new highs is in the nature of things.
Gerd Kommer also addressed the myth of the all-time high in one of his blog posts. [1] He examined the Shiller data with respect to the average return after an all-time high is reached and could not find any detrimental effect on returns. On the contrary, for short- and medium-term periods of up to three years after reaching an all-time high, average returns were actually higher than the overall average. This could be related to the so-called momentum factor, which we will highlight in an upcoming blog post. It describes that companies with recent relatively high returns tend to maintain higher returns for a limited period of time.
The mere existence of an all-time high has no informational content regarding the valuation or overvaluation of the stock market. Indeed, the absolute index value alone says nothing about the valuation of the market, but is often perceived as a valuation indicator due to its negligent use in the financial media to generate headlines.
In order to be able to assess the value of a share, the price value must be considered in relation to another variable. Fundamental business indicators such as profit, cash flow or book value are often used for this purpose. This then results in ratios such as the price-earnings ratio (P/E ratio), price-cash flow ratio (P/CF) and price-book ratio (P/B), which are also frequently stated in the fact sheets of ETFs.
Nonetheless, all-time highs are not regularly distributed. In particular, the Shiller data from the S&P 500 reveals this fact. From 1871 to 1929, 77 stock market records occurred. Then followed a long dry period from 1930 to 1954 with not a single all-time high. After that it accelerates and in the following period up to the present 225 more records have been broken.
The fact that from 1929 to 1954 not a single all-time high was reached is certainly related to the devastating crises of that time, the Great Depression and the following World War II. After that, new all-time highs were reached again and again in batches. The stabilization that set in after the World War II and the interconnection of the global economic system were probably the main reasons for the stock market’s outstanding performance.
It is also striking that the all-time highs usually occur in clusters, i.e. they follow one another at short intervals. This circumstance could in turn be related to the momentum effect. In the following section, we will therefore look at the temporal distribution of all-time highs and answer the question of how much time passes on average until the next stock market record is reached.

Figure 3 shows this distribution for the S&P 500 and the MSCI World. For most all-time highs, the time interval is only one month in line with the clustering of all-time highs. For the S&P 500 the maximum time interval is 300 months and for the MSCI World 80 months. These stock market phases can be explained by drastic crises, for the S&P 500 data as mentioned above the Great Depression and World War II, and for the MSCI World the bursting of the dotcom bubble in March 2000.
The last question we want to address is what impact the inflation has on the frequency of stock market records. We base this question on the Shiller data, which provide inflation-adjusted values in addition to nominal values. If we look at the inflation-adjusted values, the number of months with new highs decreases from 302 to 172. The share is thus reduced from 16.7% to 9.5%. Although inflation leads to a reduction of real records by about one third, real records on the stock markets are by no means a rarity.
Conclusion – Are all-time highs a suitable indicator for the valuation of the stock market?
- The occurrence of a new all-time high alone does not provide any information regarding the valuation or overvaluation of the stock market and should therefore under no circumstances be used to make investment decisions. On the contrary, if one postpones an investment in the stock market solely because of the presence of an all-time high for fear of overvaluation, this can have a negative impact on the return achieved (opportunity costs).
- For the valuation of shares, the absolute price must be set in relation to business metrics such as profit, cash flow and book value.
- New stock market records are the rule rather than the exception for long-term periods. In the past, 16.7% of all months set a new stock market record for the S&P 500 and as much as 21.6% for the MSCI World. A subset of about one-third of these records disappear when inflation is taken into account (examined only for the S&P 500).
- All-time highs often occur in clusters and their time interval is in most cases only one month (momentum effect). The banal reason for reaching new all-time highs is that stock markets have positive average returns for sufficiently long periods of time.
- The average returns achieved after a new all-time high are not smaller than the historical average.
Sources
[1]: Blog von Gerd Kommer, https://www.gerd-kommer-invest.de/angst-vor-dem-allzeithoch/ (only in German)