How did one of the biggest speculative bubbles in history erupt and what lessons can investors learn from it?
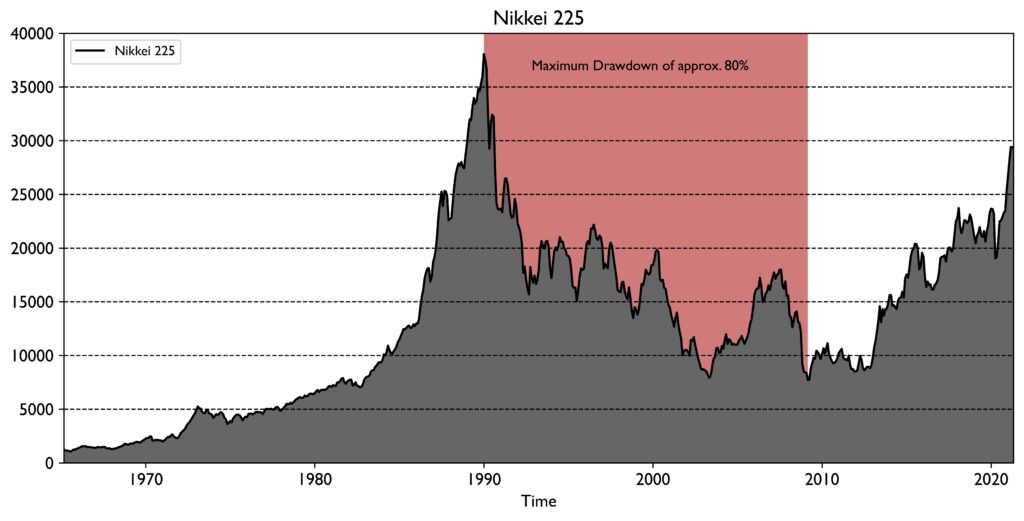
In 1990, one of the biggest speculative bubbles in history burst in Japan. The Japanese benchmark index Nikkei 225 (hereinafter also referred to as Nikkei) plunged by more than 60% within five years and has not recovered to this day. The maximum drawdown for the entire history of the Nikkei amounts to an unimaginable 80% and spans almost two decades. The Japanese economy suffered for several years and the Japanese folklore refers to this momentous period as the Lost Decades.
In this blog post, we will look at the historical performance of the Nikkei and examine it in relation to the performance of the global stock market. In doing so, we will look at what is known as home bias, the tendency of investors to disproportionately overweight home market stocks in their portfolios. Home bias is a global phenomenon. [1]
The case of the Nikkei will show why such a strategy can have damaging consequences on returns and is a plea for global diversification in stock investments.
Nikkei 225 – Japan’s leading index
The Nikkei 225 is one of the world’s most important stock indices, tracking the performance of 225 companies traded on the Tokyo Stock Exchange. Among these companies are global players such as Toyota, Nissan and Canon. The Nikkei is a price-weighted index, meaning it is calculated excluding dividends and other special payments. Figure 1 shows the historical performance from January 1965 to March 2021. The maximum drawdown of approx. 80% is drawn in red. It stretched over almost two decades.

Historical data of the Nikkei 225
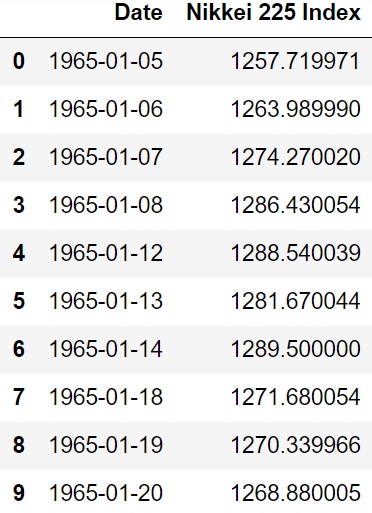
We obtained the historical price data of the Nikkei from Yahoo Finance (for more information, see Financial Data). The data covers the period from January 1965 to April 2021 and is available for most business days. The first ten measurement points of the Nikkei data can be seen in Table 1.

We will use the MSCI World as the benchmark for the analysis of the Nikkei data. We choose this index as a benchmark because it represents the lion’s share of the global stock market with the 1600 largest exchange-traded companies in the industrialized countries (including Japan, which currently accounts for 7.5% of the index). Even more suitable would be the MSCI ACWI, which includes emerging markets in addition to the industrialized countries. For this index, however, the available data does not extend far enough into the past. The MSCI World data goes back to 1970 and is available at monthly intervals. To compare the two indices, we will look at the MSCI World in price index form. The first ten measurement points of the MSCI World are shown in Table 2.

Analysis – Comparison of the return distribution Nikkei 225 vs. MSCI World
In the following, we will compare the performance of the Nikkei 225 with that of the MSCI World. Figure 2 shows the historical performance of the two indices over the last 50 years on a logarithmic scale.

The price trend of the Nikkei can be roughly divided into three phases I, II, and III with long-term trends. In phases I and III, the Nikkei rises just like the MSCI World, albeit with short-term setbacks. The situation is different in phase II, which stretches from 1990 to 2012. While the MSCI World more than doubled during this period, rising from 557 to 1315 points, the Nikkei fell from 38,064 to 9057 points. That is a drop of almost 80%. Although a correlation between the two indices can also be identified for this period, e.g. the bursting of the dotcom bubble in 2002 or the major financial crisis in 2008, the general trend for the two indices was the opposite.
What impact did this phase have on the Nikkei’s return distribution? To answer this question, Figure 3 shows histograms of the return distributions of the Nikkei and the MSCI World.

The distribution of returns shows that the distribution for the Nikkei is somewhat broader than for the MSCI World, i.e. months with particularly high negative or positive returns occur more frequently for the Nikkei. Nevertheless, the average returns for the total period show only minor differences. For the Nikkei, the average monthly return is 0.57% and the annual return is thus 7.06%, while the MSCI World is just above this with a monthly value of 0.64% and an annual value of 7.96%. It is important to note that these values are nominal values and no dividends have been taken into account.
But how do things look if we only consider the critical period II from 1990 to 2012? After all, this period spans two decades and even up to the present day, the record values of the Nikkei have not been reached again. The distribution of returns for this period is shown in Figure 4.

With the beginning of the 1990s, the speculative bubble on the national stock and real estate market burst in Japan. Figure 4 demonstrates the devastating consequences this development had on the returns of the Nikkei. While the MSCI World’s monthly return of 0.41% (5.03% annually) is slightly lower than for the period as a whole, the Nikkei fabricated a negative monthly return of 0.39% (-4.78% annually).
It is noteworthy that this negative return was not achieved over a short period of a few years, which is often the case during major stock market crashes, but over a period of more than two decades. Another important finding is that this development was limited to the Japanese stock market. Although returns on the global stock market were also lower for this period, price gains were still achieved in contrast to the Nikkei. The suspicion is therefore that the reasons for this prolonged bear market were of national origin.
Reasons for the crash of the Nikkei 225
From 1980 to 1985, the U.S. dollar experienced a 50% appreciation on the international currency markets against the currencies of the other G5 nations at that time (Great Britain, West Germany, France and Japan). This development led to great economic difficulties in the American industry, since imported products, including those from Japan, could be offered at much lower prices than domestic products. This development led to large imbalances in the trade balances to the disadvantage of the USA. After the U.S. industry was able to build up sufficient pressure on the government, the Plaza Agreement was concluded between the G5 nations in 1985 at the urging of the United States.
The aim of the Plaza Agreement was to eliminate imbalances in trade balances through controlled measures in the international currency market. Following the intervention under the Plaza Accord, the value of the yen fell from 238 per dollar in 1985 to 165 yen per dollar in 1986. [2]
However, the appreciation of the yen accelerated faster than planned as speculators, driven by the appreciation, pumped massive amounts of capital into buying yen and investing in the Japanese real estate and stock markets. The Louvre Agreement in 1987 attempted to counteract the yen’s appreciation, but to no avail. The massive inflow of capital as a result of the yen’s appreciation ultimately led to very high valuations of Japanese companies and real estate, and this ultimately led to one of the largest speculative bubbles in history at the national level. As a result of the strong appreciation of the yen starting in 1985, Japan’s international competitiveness deteriorated and the Japanese central bank failed to take appropriate measures to counteract it.
The fact that the speculative bubble on the Japanese stock market was able to develop in this form was thus largely fueled by political decisions at the international level, and the Japanese government did not find suitable means to counteract this development.
The risk of home bias
What conclusions can investors draw from the fall of the Nikkei? The multilateral Plaza Accord of 1985 was largely responsible for the emergence of the speculative bubble in Japan. As a result of the Plaza Accord, the yen appreciated dramatically against the U.S. dollar. The Japanese central bank failed to prevent or at least cushion the emergence of the speculative bubble with fiscal policy measures.
The result was a bear market for the Japanese benchmark index that lasted for more than two decades, with losses of up to 80%. Although this period was not the best for the global stock market either, prices for the MSCI World more than doubled during this time. So if you had been a typical Japanese stock investor with your typical dose of home bias during that time, you would have experienced painful losses in the stock market. The globally diversified investor with an investment in the MSCI World would have more than doubled his assets in nominal terms instead.
What is the reason behind home bias? Apparently, psychological factors play an important role here, especially the investor’s feeling that he knows the companies of his own country and is thus better able to judge their shares (stock picking by the active investor). The more competence one attributes to oneself, the greater the tendency toward home bias. Whether this self-attributed competence is of actual nature may be doubted.
So if you don’t trust yourself to reliably forecast the developments of the global economy and the international currency market and their implications for the domestic stock market, you should rather rely on a globally diversified stock portfolio. Of course, there will always be national stock markets, that will outperform a globally diversified index for a certain period of time, e.g. currently the US stock market . But if you cannot reliably forecast this market, you will not be able to take advantage of this circumstance.
Conclusion – What conclusions can investors draw from the crash of the Nikkei 225?
- At the end of 1989, one of the biggest national speculative bubbles of all time burst on the Japanese stock market. Japan’s leading index, the Nikkei, recorded losses of up to 80% and has still not been able to regain its all-time high of that time.
- While the Nikkei succumbed to a bear market over a period of two decades with an average return of -4.78%, the MSCI World generated a positive annual return of 5.03%.
- Home bias can result in large losses in extreme cases or reduced returns in less drastic cases. With ETFs it is nowadays very easy and cost effective to avoid this risk and to build up a globally diversified stock portfolio.
What is your situation? Do you mainly have stocks or ETFs with a focus on a specific country or region in your portfolio and what are the arguments for this approach? Or do you go for a globally diversified approach?
Sources
[1]: Vanguard, https://personal.vanguard.com/pdf/ISGGAA.pdf
[2]: World Bank, https://data.worldbank.org/indicator/PA.NUS.FCRF?locations=JP


