How have the weights of the various sectors in the MSCI World developed over time and which companies dominate the respective sector?
With an ETF tracking the MSCI World, investors have access to a total of 1,600 companies from around 23 industrialized countries. In addition to diversification across national borders, the MSCI World includes companies from every imaginable sector – from car manufacturers to software developers to fast food providers.
Together with Standard & Poor’s, the index provider MSCI has developed its own system for classifying companies into different sectors, the so-called Global Industry Classification Standard (GICS). In GICS, the economy is divided into a total of eleven different sectors, all of which are represented in the MSCI World.
In this blog post, we will take a closer look at the composition of the MSCI World with respect to these sectors. We will explain what is behind each sector and look at their top companies. We will also examine how the weighting of each sector in the MSCI World has evolved over the past decade.
The analysis will show that there has been one sector that has managed to significantly outperform all other sectors in terms of return over the last ten years. One conclusion that could be drawn from this development might be to overweight certain sectors with superior past performance in the portfolio. We will reveal why this is not a recommended strategy and how this fallacy is related to the so-called recency bias.
Global Industry Classification Standard (GICS)
The GICS divides the economy into eleven different sectors and is defined jointly by Standard & Poor’s and MSCI.
- ENERGY
- MATERIALS
- INDUSTRIALS
- CONSUMER DISCRETIONARY
- CONSUMER STAPLES
- HEALTH CARE
- FINANCIALS
- INFORMATION TECHNOLOGY (IT)
- COMMUNICATION SERVICES
- UTILITIES
- REAL ESTATE
In further steps, these sectors are subdivided into 24 industry groups and 69 industries, resulting in a total of 158 sub-industries. [1] A detailed overview of which sub-industries are behind the individual sectors can be found in the GICS Wikipedia article. Each company is assigned to exactly one sub-industry and thus also to exactly one sector.
Due to the existence of large corporations that are active in numerous business areas, the clear assignment to one sector and one sub-industry is not always obvious. Let’s take the example of Amazon, which started out as an online retailer of books. In addition to online mail order, Amazon is now active in numerous other business areas ranging from cloud computing (AWS) to entertainment (Amazon Prime Video) to payment services (Amazon Pay). Each of these business areas corresponds to a different sector. However, since Amazon’s focus remains on online shopping, the GICS classification places Amazon in the Consumer Discretionary sector. Should the focus change in the future, Amazon would be assigned to a different sector.
The GICS standard is constantly updated and adapted to new circumstances. Over the years, sub-industries, industries and branches of industry have been added, deleted or redefined. There have also been changes at the sector level:
- In 2016, the real estate industry, with the exception of mortgage securitization, was separated from the financial sector into a distinct sector. The number of sectors has thus risen from ten to eleven. [2]
- In 2018, the telecommunications sector was renamed to communication services. In the process, companies from the media and entertainment sector that previously belonged to consumer discretionary were assigned to this new sector. In addition, companies from the interactive media sub-industry (e.g. Facebook) that were previously in the IT sector were assigned to the communications sector. [3]
We will see the second revision of the GICS in 2018 in the time trend of the MSCI World sector weighting, as the reclassification has led to strong changes in the weighting of the relevant sectors. More on this in the analysis.
In addition to the GICS standard, there are other classification standards that are used for stock indices. FTSE, which compiles the FTSE All-World Index, which is very popular among investors, assigns stock companies to sectors or industries according to the so-called Industry Classification Benchmark (ICB). The ICB is very similar to GICS.
Data for MSCI World composition by sector
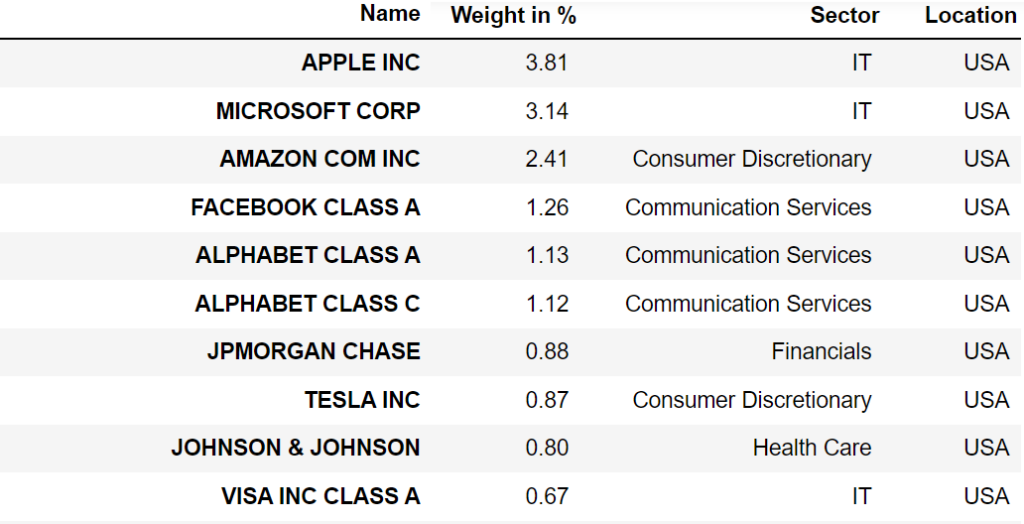
I have compiled the MSCI World weighting data by sector from the factsheets of the last ten years. The data is available at monthly intervals for the period from January 2011 to March 2021. Since the data from the factsheets come from an ETF with optimized sampling, there may be slight deviations compared to the original index. You can see the first ten data points for March 2021 in Table 1.

Analysis – Historic development of the composition of the MSCI World by sector
In order to be able to track the development of the sector weighting in the MSCI World over time, I have grouped the data presented above according to the “Sector” column and then summed up all values for the weighting. As the GICS framework combined the current financials sector and the real estate sector until 2016, we will use the old standard for the analysis of the time trend after 2016 as well. In total, we track the development of ten sectors over time according to this standard.
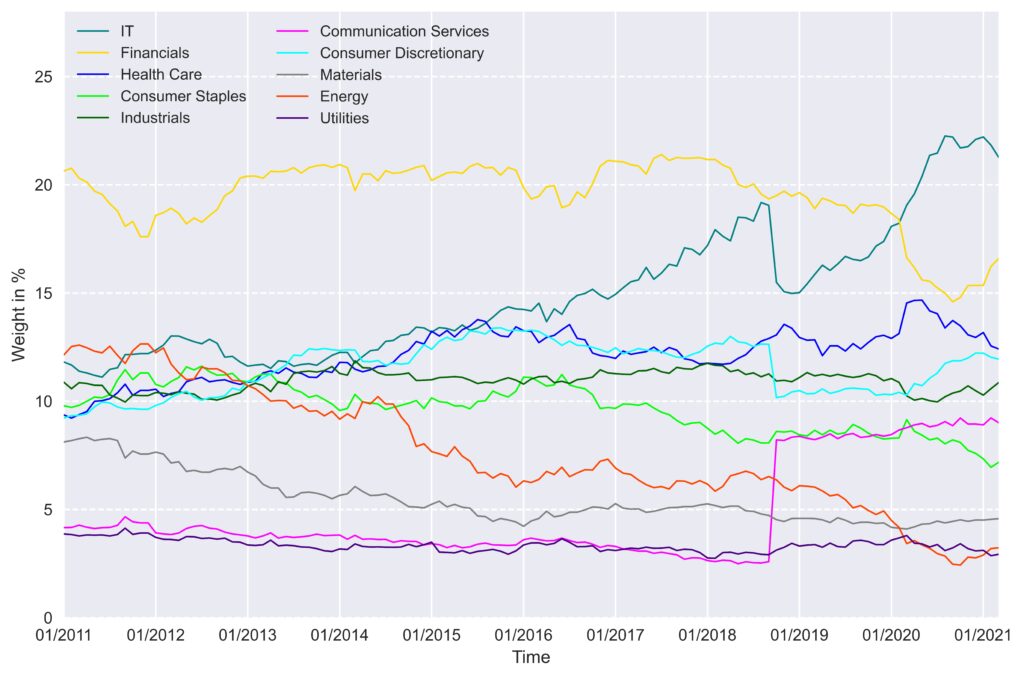
The development of the weights by sector over time for the MSCI World is shown in Figure 1.

The development of the weightings over time reveals some interesting trends over the last ten years. At the beginning, the weightings of all sectors, except for financials, communications and utilities, are all very close together, between 8% and 12%. Over the next ten years, the weightings have diffused very widely, ranging from 3 to over 21%.
The performance of the IT and energy sectors is particularly noteworthy. The IT sector almost doubled its weighting from 11.8% to 21.3%, thus ousting the financial sector from its throne. This development is related to the very large price gains of US tech stocks such as Apple and Microsoft in recent years (see MSCI World Top 10 Positions over the Last 10 Years – Is there a Cluster Risk? for more information). The energy sector, on the other hand, suffered one of the worst performances from an initial 12.1% to just 3.2%.
The development of the IT sector is even more impressive considering the revision of the regulatory framework that took place in 2018. As a result of this revision, interactive communications services (e.g. Facebook) that were previously part of the IT sector were henceforth assigned to the communications sector. Despite the loss of these companies and an interim reduction in IT weighting from 19% to 15%, the rise of the IT sector has not been curbed decisively.
The significant increase in the weighting of the IT sector is equivalent to an above-average return for this sector compared with the overall MSCI World index. As an investor, one could now make the decision to overweight certain sectors or to focus one’s portfolio entirely on one particular sector. After all, ETFs on the MSCI World Information Technology Index offer the opportunity to invest exclusively in companies from the IT sector and in recent years one could have achieved a much higher return than with market-neutral investing. Why this is nevertheless not a recommendable strategy, will be examined in the next section.
Analysis – MSCI World Information Technology vs. MSCI World
The significant gain of the IT sector in the MSCI World is based on the strong performance of companies such as Apple and Microsoft, whose market capitalization has increased much more than the market average in recent years. ETF investors could be tempted to just rely on a specific sector that outperformed the broad market or to at least overweight this sector.
In order to illustrate that this strategy carries a lot of risk, we will review the development of the MSCI World Information Technology Index below. This index contains all companies of the MSCI World that are assigned to the IT sector. Currently, that’s 185. Compared to the 1600 companies of the MSCI World, this is a significant setback in terms of diversification.
Nevertheless, over the last ten years, the MSCI World Information Technology has achieved an annual return of 18.5%, while the MSCI World has only been able to achieve 9.9%. [4] Among some investors and also in the financial media, this extraordinary performance in recent years has led to the assumption that technology stocks produce permanently higher returns than the overall stock market.
One reason for this misconception is the so-called Recency Bias. It describes the human tendency to attach greater importance to data from the recent past than to older data. Technology stocks that outperform the market are thus perceived as the new normal. This perception is then fueled by the financial media, which promotes a new sector every day as the new non plus ultra investment. And ETF providers are responding with more and more ETFs on individual sectors or industries, which often mean higher management fees for the investor and much poorer diversification.
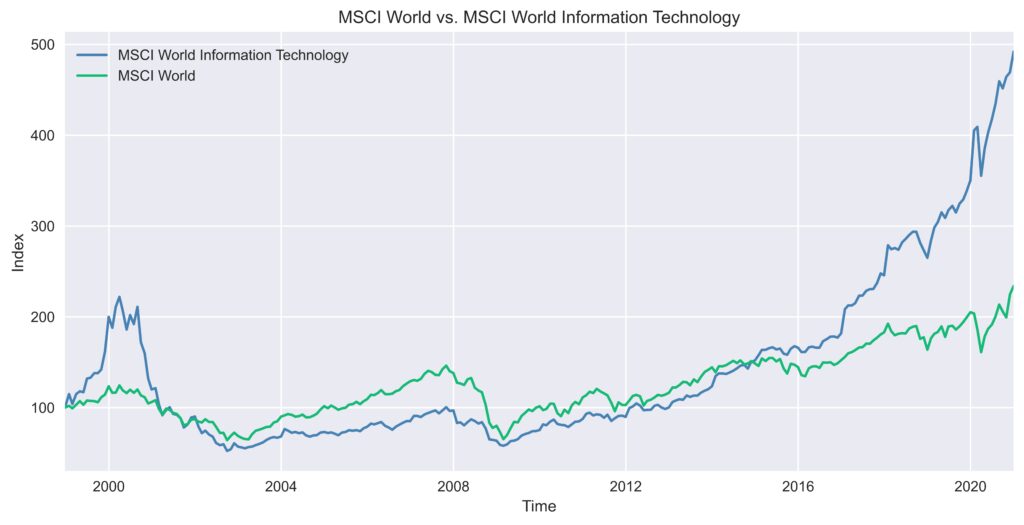
Yet it wasn’t that long ago for the IT sector to cause investors drastic losses. If we extend the period under consideration to just over 20 years (since when the MSCI World Information Technology has existed), this period includes one of the biggest speculative bubbles at sector level ever, the Dotcom Bubble at the turn of the millennium. The developments for the price index versions of the MSCI World and the MSCI World Information Technology during this period are shown in Figure 2.

The bursting of the Dotcom Bubble led to a maximum drawdown of more than 80% for the MSCI World Information Technology, whereas the maximum drawdown for the MSCI World was just 50 % during the Great Financial Crisis of 2008. It took the MSCI World Information Technology more than 17 years to reach the all-time high of the dotcom bubble again. The MSCI World needed just seven years to do so. These figures reveal that investing in a single sector can lead to dramatically increased risk and long-lasting losses. Consequently, many investors who burned their fingers with technology stocks during the Dotcom Bubble never returned to the stock market.
Conclusion
- Over the past ten years, the weighting of the individual sectors in the MSCI World has diffused considerably. While the weightings were very similar for many sectors at the beginning, the dispersion is much stronger today.
- The IT sector was able to almost double its weighting due to the extraordinarily good performance of IT companies.
- Nevertheless, investments in individual sectors should be avoided. After all, if you look at longer periods of time, the associated risk is much higher and individual sectors cannot consistently beat the market. Gerd Kommer has written an insightful blog post on this topic. [5] His research shows that over the last 50 years, the high-tech sector has delivered returns similar to the overall market, but with much greater maximum drawdown and volatility. The best shareholder returns have been in weapons manufacturing and the second highest in tobacco.
Sources
[1]: S&P und MSCI, GICS Standard
[2]: S&P und MSCI, GICS Revision 2016
[3]: S&P und MSCI, GICS Revision 2018
[4]: MSCI, MSCI World Information Technology Factsheet
[5]: Gerd Kommer, https://www.gerd-kommer-invest.de/haben-technologieaktien-hoehere-renditen/ (in German)


