
Nowadays, the shares of tens of thousands of companies are traded on stock exchanges around the world. Among them are the most valuable companies in the world. The stock exchange thereby fulfills important functions for the economy. On the one hand, the value of companies is determined efficiently and transparently, and companies have the opportunity to obtain new capital by issuing shares. On the other hand, investors have the opportunity to participate in the economic development of these companies through the acquisition of company shares. And with ETFs, private investors are able to invest in a large number of these listed companies easily and cost-effectively.
In this blog post, we will look at the historical development of the number of listed companies over the last three decades. In addition to the global trend, we will also look at the trend in the ten countries that are currently home to the most valuable listed companies as measured by market capitalization. These include both the developed countries of the US, UK, Japan, Canada, France, Germany, Switzerland and Australia, as well as two emerging markets, China and South Korea.
In the second part, we will then look at how important listed companies are in economic terms. We will measure this by relating the market capitalization, e.g. the value of companies, to the gross domestic product (GDP). The most common ETFs are based on indices in which companies are weighted according to their market capitalization. However, there are also voices that believe weighting by the GDP is a better option. Our exploration will show one of the most obvious arguments against such an approach.
In the final part, we will look at how many companies are included in the most popular ETF indices such as MSCI World, MSCI ACWI and FTSE All World.
Data for the historical development of the number of listed companies and their market capitalization in relation to the GDP
The data on the historical development of the number of listed companies and their market capitalization in relation to the GDP comes from the World Bank. The time trend for the number of listed companies can be found at the following link: World Bank, https://data.worldbank.org/indicator/CM.MKT.LDOM.NO
The data record for some countries, such as Germany, starts as early as 1975. However, for some countries with the currently most valuable listed companies, such as China, the data is only available from 1995 onwards. Therefore, we start our analysis on this date. The World Bank defines listed companies as companies that are listed on the stock exchange at the end of the year. Mutual funds and companies whose sole business purpose is to hold shares of other listed companies are excluded. A company with multiple classes of shares is counted only once. The data is available at annual intervals. In Table 1 you can see an extract of data for the countries mentioned above:
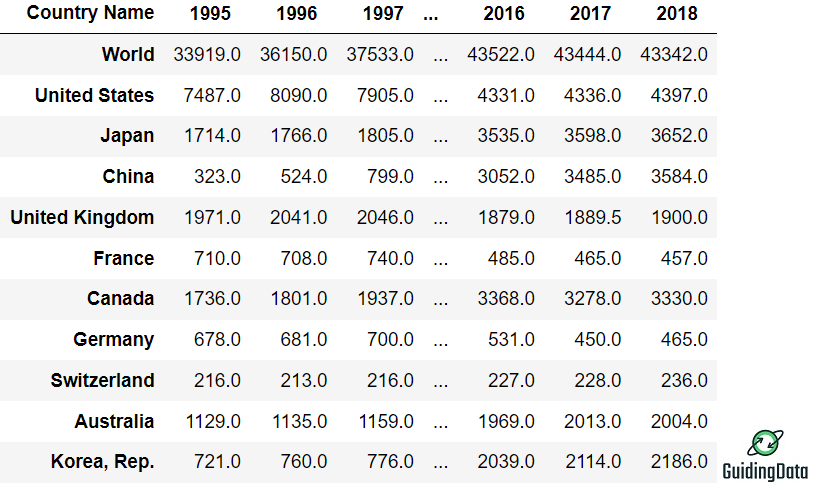
As described above, we limit our analysis to the ten countries with the largest market capitalization. Actually, this list should include Taiwan and not South Korea. However, since China does not recognize Taiwan’s sovereignty, the World Bank refrains from listing Taiwan in the database for political reasons.
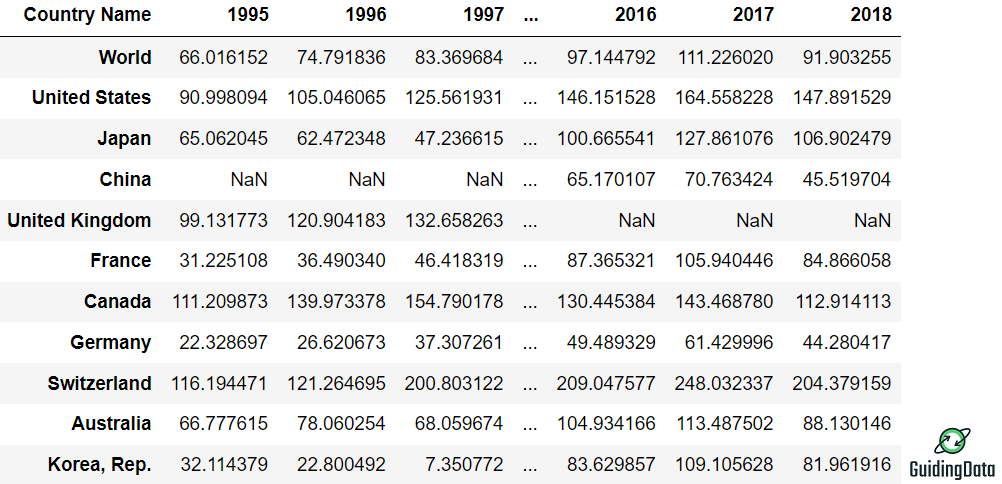
The data for the market capitalization of all listed companies in a country in relation to the national GDP comes from the World Bank as well. You can find the data at the following link: https://data.worldbank.org/indicator/CM.MKT.LCAP.GD.ZS
In table 2 you can see an extract of the data. For the UK, data is only available up to the year 2009, and for China only from the year 2003 onwards.
Historical development of the number of listed companies
The development over time is shown in Figure 1. Globally, the number of listed companies increased sharply from 1995 to 2018, from around 34,000 to over 43,000. The global trend also shows the impact of major stock market crashes on the number of listed companies. When the Dotcom-Bubble burst in 2002, the number fell from almost 42,000 to under 36,000 companies in the aftermath. The number also fell from 44,000 to 43,000 companies during the major financial crisis in 2008. However, the general trend for the entire period points strongly upward.

Which countries drove this development? If you look at the development of the individual countries, you can see contrasting trends. In the USA, the number of listed companies has halved from approx. 8,000 to approx. 4,000. The most impressive development has taken place in China. The number of listed companies has increased more than tenfold from around 300 companies to 3,500.
Among the industrialized countries, only Canada and Japan were able to significantly increase the number of their listed companies. In the case of Japan, this is certainly related to the incipient recovery of the domestic economy from the bursting of one of the largest national speculative bubbles at the beginning of the 1990s. In Germany, the number of listed companies has developed negatively, from a maximum of 750 to less than 500 in 2018.
Market Capitalization vs. GDP
In this section, we look at how the total value of all listed companies has developed in relation to the national GDP for the last few decades. This development is shown in figure 2. Market capitalization is measured here as a percentage of the national GDP, i.e. a value of 80% means that the market capitalization corresponds to a value of 80% of the national GDP.
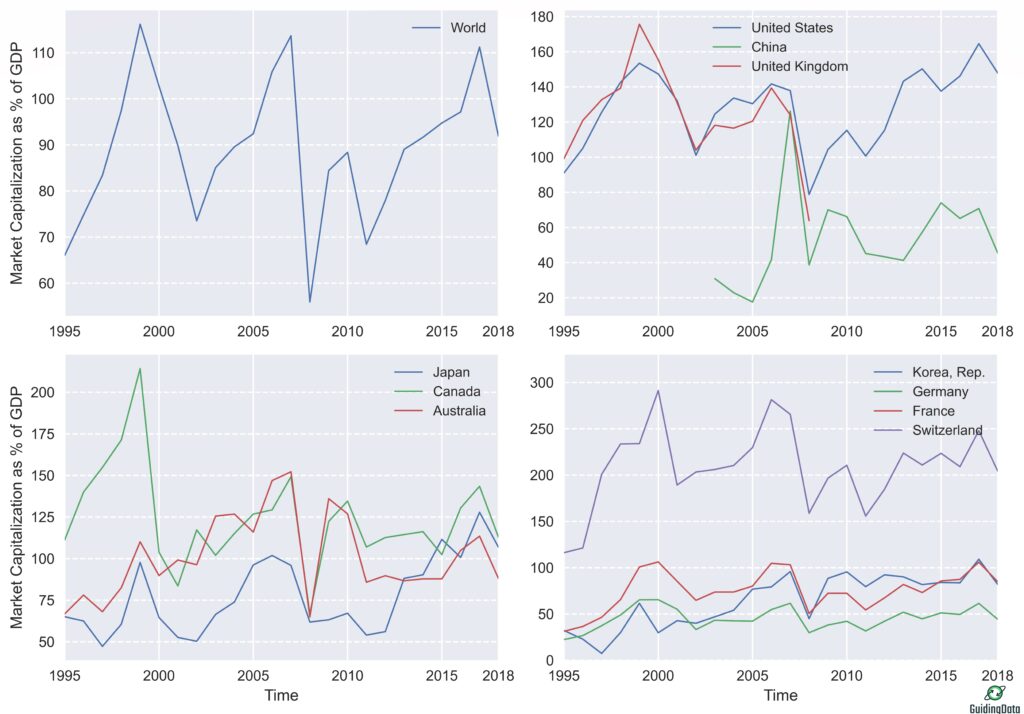
Worldwide, the value fluctuates between 60% and 100% . As with the number of listed companies, we can clearly see the influence of market crashes like the Dotcom-Bubble in 2002 and the Great Recession in 2008.
For some countries, the value is very high. For the USA, the value fluctuates around 120%. For tiny Switzerland, which has produced some of the most valuable companies in the world, such as Nestlé, the value is well over 200% for certain periods. Of course, this is also due to the fact that companies like Nestlé operate globally and generate a large share of their profits in foreign markets.
However, there are also countries, such as Germany and for some periods also Japan, for which the value is far less than 100%. For Germany, the figure is never far from the 50% mark, despite the fact that it is home to globally active companies with its automotive industry. The reason for the low value is the strength of the German small and medium-sized business sector. Small and medium-sized companies generate more than one in every two euros in Germany, but they are generally not listed on the stock exchange. [1]
When assessing whether to base one’s portfolio on market capitalization or the GDP, this fact provides a conclusive argument against the GDP weighting. The simple reason is that not all companies that contribute to the generation of the GDP are listed on the stock exchange. Moreover, listed companies such as Apple, Amazon and VW generate their sales globally, and production does not take place exclusively on the domestic market either. So if VW manufactures and sells a car in China, this has no impact on the German GDP, but it does on VW’s market capitalization. Weighting a portfolio according to the GDP in a globally interconnected economy is thus arbitrary to a certain extent.
Number of Companies in known ETF Indices
In this section we look at how many companies are included in well-known indices used for ETFs. For April 2021, you can find this information for MSCI ACWI IMI, MSCI ACWI, FTSE All World, MSCI World, MSCI EM, MSCI World Small Cap and MSCI EM Small Cap in Figure 3.
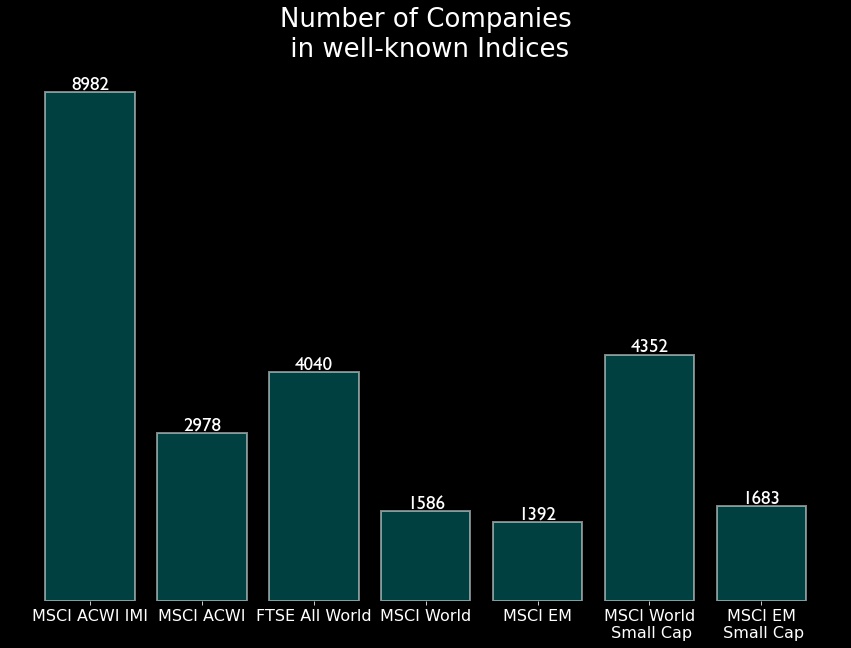
Looking only at the number of positions, the MSCI World, for example, contains only 3.7% of all listed companies worldwide. By contrast, the MSCI ACWI IMI, which includes industrialized and emerging markets as well as small caps, accounts for 20.7%. By market capitalization, of course, things look different; the MSCI World contains about 85% of the market capitalization of all industrialized countries and the MSCI ACWI IMI 99% of the market capitalization of all industrialized and emerging countries.
Conclusions
- The number of listed companies has increased sharply over the last three decades, from around 34,000 to over 43,000.
- Some countries, such as the USA and Germany, have lost many listed companies during this time, while in China the number has increased more than tenfold.
- The individual countries show strong structural differences in the importance of listed companies for the domestic economy. In Germany, the market capitalization of all listed companies was very constant at 50% of the national GDP, while in the USA the value fluctuated around 120%.
Sources
[1]: Federal Ministry for Economic Affairs and Energy of Germany, https://www.bmwi.de/Redaktion/DE/Publikationen/Mittelstand/wirtschaftsmotor-mittelstand-zahlen-und-fakten-zu-den-deutschen-kmu.html (in German)