The stock market year 2021 – a roller coaster between euphoria and worries
Soaring inflation, accompanying announcements of a tighter monetary policy, fears of new variants of the coronavirus, Reddit users taking on big hedge funds, complications in global supply chains, but also a new generation of young investors – in 2021, there were numerous developments that influenced prices on the stock markets. Despite this economic environment, which is increasingly characterized by uncertainty, investors can look back on the stock market year 2021 with satisfaction. Many major stock indices in the industrialized countries (e.g. DAX, S&P 500, CAC 40) rushed from record high to record high last year, giving shareholders strong price gains.
In this review for the stock market year 2021, we want to take a closer look at the performance of the MSCI World, one of the most popular ETF indices among investors. In addition to analyzing the price performance, we will look at the following aspects:
- Return distribution of the MSCI World in 2021 compared to historical performance
- Development of the Top constituents
- Development of cumulative weighting of Top 10, Top 20, Top 50 and Top 100
- Development of sector weighting in 2021
- Development of country weighting in 2021
Price development of the MSCI World for 2021
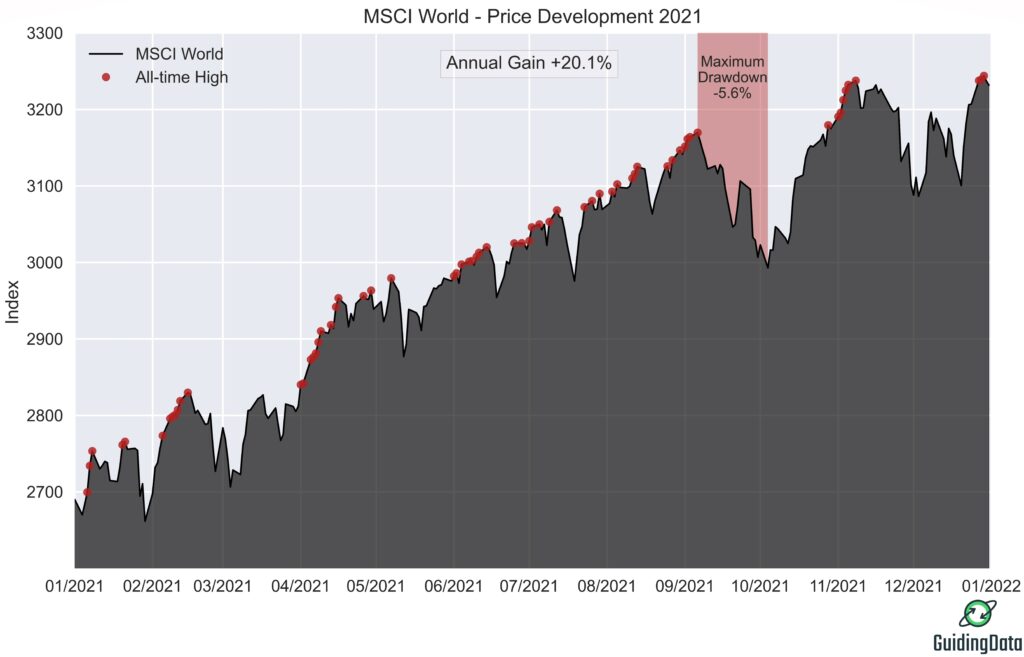
The MSCI World managed an impressive performance with significant price gains in 2021. Starting from an index value of 2690 points at the beginning of the year, the MSCI World (price index excluding dividends) stood at 3232 points on the last day of the year. This corresponds to an annual gain of 20.1%. The total price development for the year 2021 is shown in Figure 1. The data stems directly from MSCI.
The prices correspond to the end-of-day prices. Despite temporary setbacks, the MSCI World reached a total of 65 all-time highs over 260 trading days during the year. Thus, a quarter of all trading days recorded a new record high. The only month in which the index failed to reach an all-time high was March. The index reached its current all-time high on December 29 with 3244 points.
The returns on the individual trading days of the stock market year 2021 are shown in Figure 2. For investors, the year 2021 was associated with sharp price declines on several occasions. The index experienced phases of high volatility, particularly in the first quarter and at the beginning of the fall.
In particular, the persistently high level of inflation in the fall fuelled doubts among investors as to whether the high inflation rates were really only of a temporary nature. The renewed inflation fears put pressure on the central banks. While the ECB continued to expect a temporary surge in inflation, the U.S. Federal Reserve announced in September that it would be scaling back its bond-buying program in the short term.
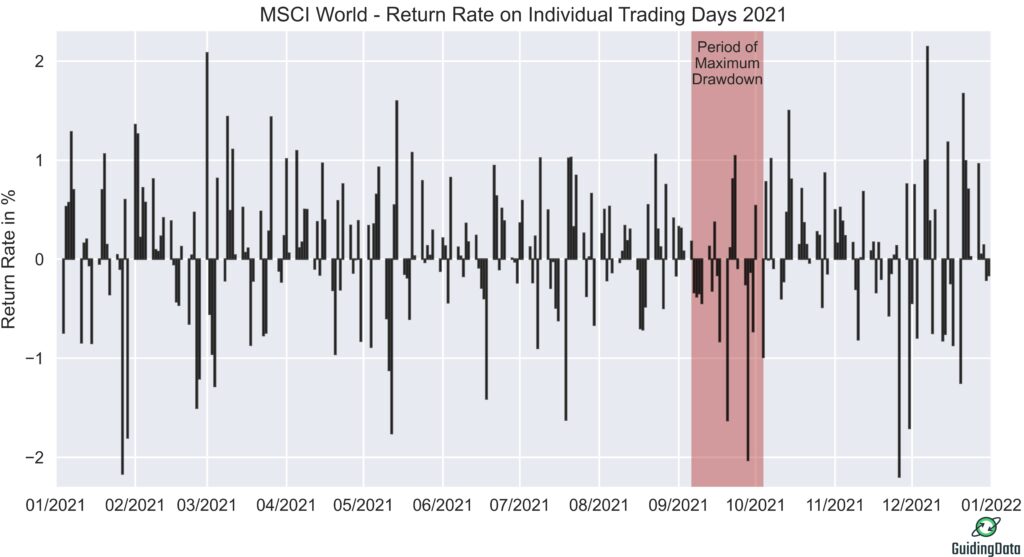
The announcement of a tougher course by the U.S. Federal Reserve in view of the inflation risks put pressure on the stock markets. The MSCI World also experienced sharp price falls and the index recorded its maximum drawdown during this phase. Starting from a price level of 3170 on September 6, 2021, it fell within a month to 2993 points on October 4, 2021, corresponding to a maximum drawdown of 5.6%. However, the MSCI World rebounded rapidly and reached a new record high of 3238 points within a few weeks at the beginning of November.
Then came the Omikron virus variant, which was discovered for the first time in November. It caused a trend reversal on the stock markets. Due to fears of new economic setbacks caused by the highly contagious variant, the stock market month of November ended deeply in the red despite an initial all-time high. But even this setback was only short-lived.
In the last stock market month, investors’ hope was greater than their skepticism. The market seems confident that the pandemic restrictions, which have been tightened again, will only be in force for a comparatively short time and will therefore have little impact on the economy and corporate profits. Driven by these hopes, the tailwind from highs on Wall Street and a strong Nikkei 225 (highest closing level since 1989), the MSCI World also reached its new all-time high two days before the end of the year. Nevertheless, the special risks of the second Corona year will remain in place next year and are likely to cause some turbulence on the stock market again.
MSCI World – Return distribution for 2021
Figure 3 shows the daily return distribution of the MSCI World for the year 2021. The arithmetic mean of the returns is 0.073% and the daily volatility is 0,7% . Given the numerous uncertainties that characterized this stock market year, one would expect the market to have been particularly volatile this year. However, if we compare the annualized volatility value of 11.3% with history, it is lower than the average value of 14.9% over the past 50 years.
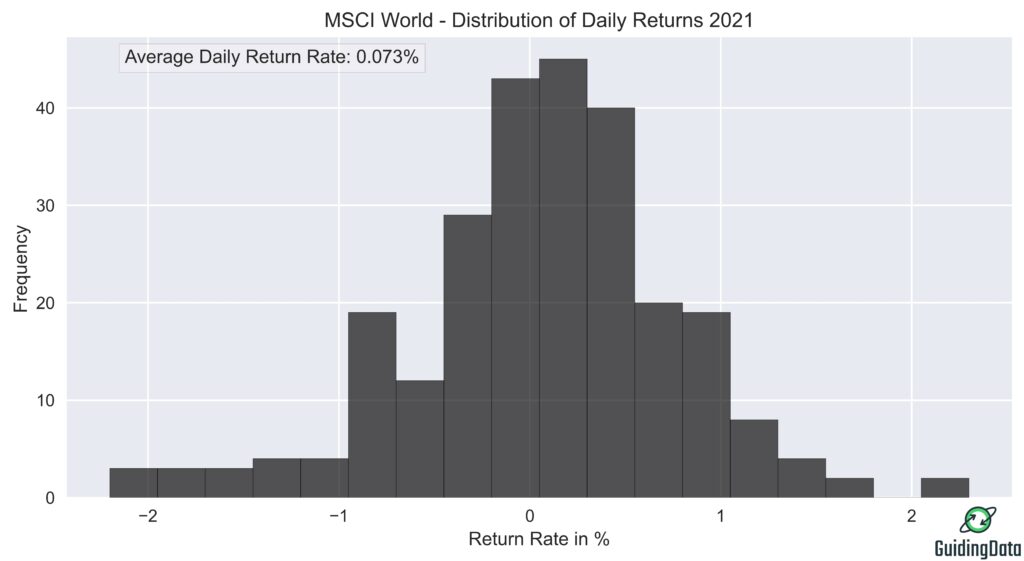
The price of the MSCI World was reported by MSCI on 260 trading days. Of these, 152 recorded a positive return and only 108 a negative return. Similar to the historical return distribution, the 2021 return distribution also exhibits an asymmetry, with an overweighting of days with particularly negative returns when compared to a normal distribution. The highest return rate was achieved on December 7 with 2.1% and the lowest on November 26 with -2.3%.
Development of the Top 20 constituents in 2021
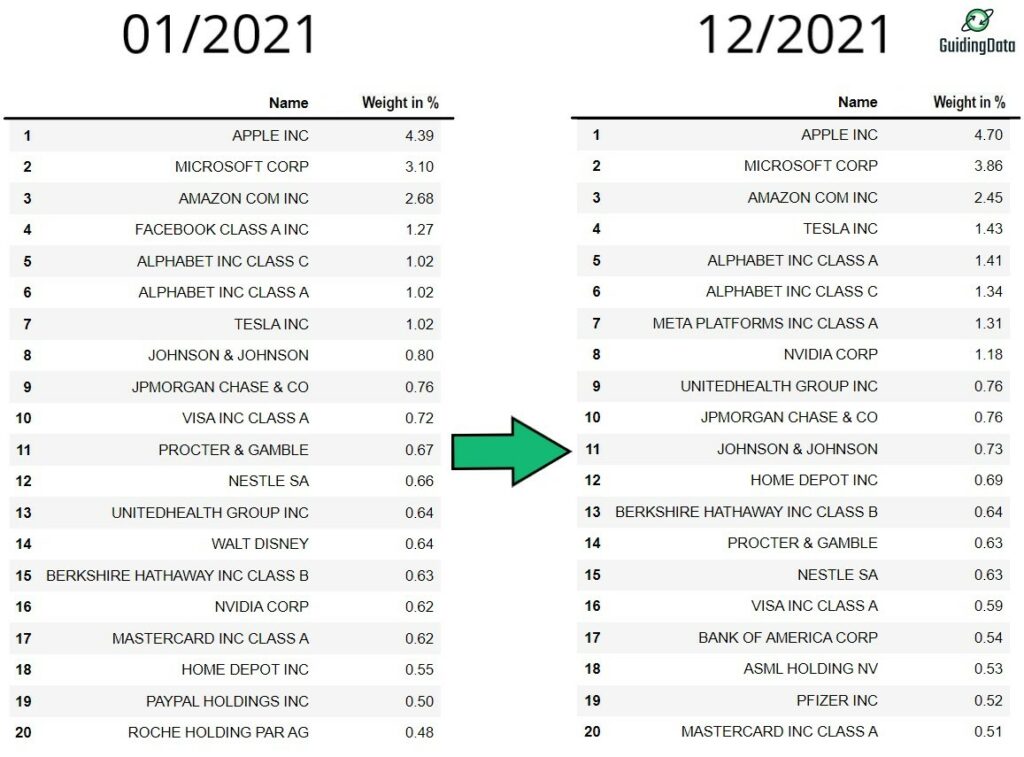
Over the past ten years, the dominance of tech companies from the USA in the MSCI World has continued to increase. The past year is no exception. Figure 4 shows the Top 20 constituents and their weightings at the beginning and end of the year. With the exception of Amazon and Paypal, all tech companies in the Top 20 made significant increases in weighting. Nvidia even saw its weighting almost doubled from 0.62% to 1.18% due to the global shortage of semiconductor chips.
Some companies in the healthcare sector also made strong gains. The share price of the vaccine developer Biontech, which is listed on the U.S. technology exchange Nasdaq, rose by 195 percent, catapulting the Germany-based company to the 19th place in the MSCI World.
The following companies lost their place in the Top 20: Walt Disney, Paypal, Roche.
The following companies entered the Top 20 during the year: Bank of America, ASML, Pfizer.
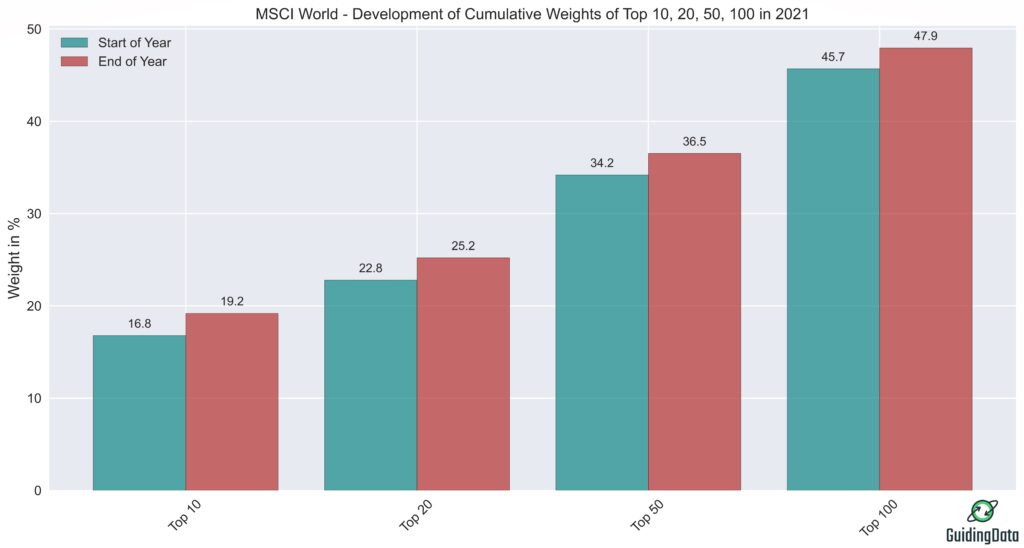
Development of cumulative weighting of the Top 10, Top 20, Top 50 and Top 100 of the MSCI World
In recent years, the cumulative weighting of the Top constituents in the MSCI World has continued to increase. The development for the year 2021 is shown in Figure 5. In particular, the extraordinarily good performance of U.S. tech companies and the run on them due to the Corona pandemic have further reinforced this imbalance.
The year 2021 did not halt this trend. While the Top 10 accounted for 16.8% of the MSCI World at the beginning of the year, this figure had risen to 19.2% by the end of the year. The Top 20, 50 and 100 also increased their cumulative weights. The Top 100 is now only approx. 2 percentage points away from accounting for half of the weighting of the entire index.
You can find the development of the cumulative weights for the Top constituents of the MSCI World over the past decade here.
Development of sector weighting of the MSCI World in 2021
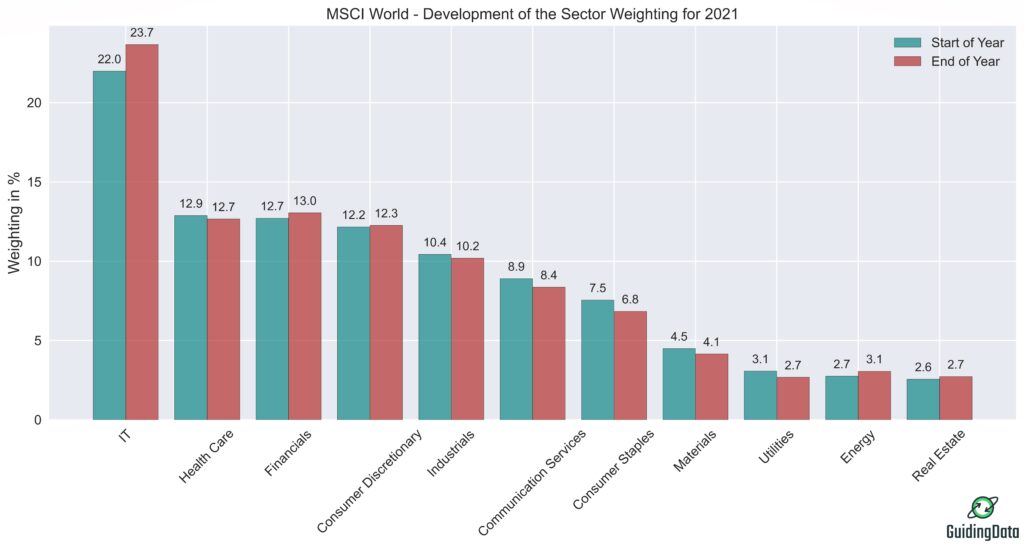
The rise of tech companies over the last decade is also reflected in the MSCI World weighting by sector. Figure 6 shows the development of the weighting of all GICS sectors in 2021. Starting from a high level of 22%, the IT sector increased its weight again this year by 1.7 percentage points to 23.7%. Driven by the economic recovery, the energy sector also posted an increase of 0.4 percentage points. Among the losers with larger losses were the communication services, consumer staples, materials and utilities sectors.
You can find the development of the sector weighting of the MSCI world for the past decade here.
Development of the country weighting of the MSCI World in 2021
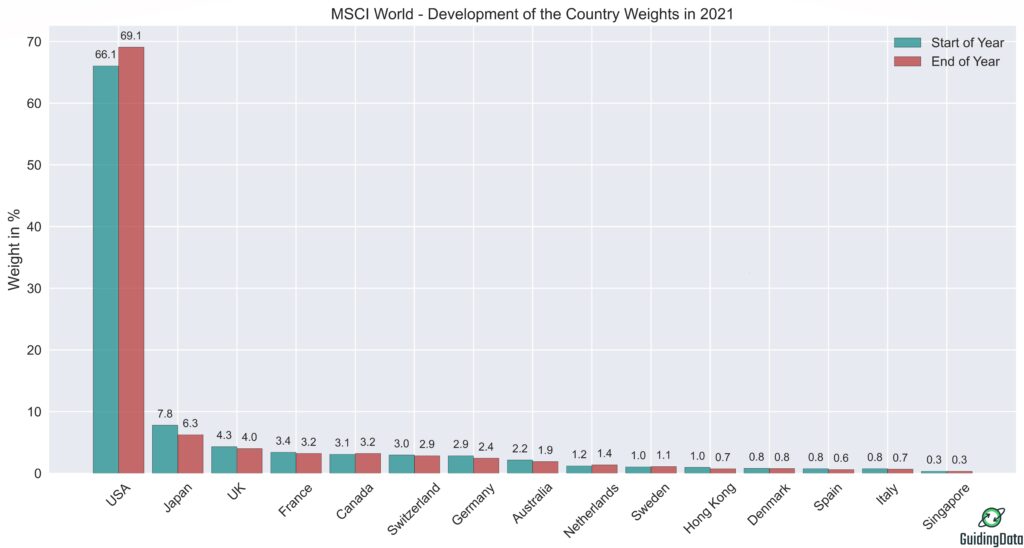
Figure 7 shows the development of the weighting of the Top 15 countries of the MSCI World in 2021. A frequently voiced criticism of the MSCI World is the strong focus on companies from the USA. Due to the strong performance of companies such as Apple, Alphabet, Microsoft and Co., the US has been able to extend its dominance over the last decade. In 2021, again, it was the only country with notable gains. The US was able to increase its very high starting level of 66.1% by a further 3 percentage points.
Despite heavy losses, Japan remains in second place with 6.3%. Germany was able to defend its position in 7th place, but suffered major losses from 2.9% to 2.4%, despite the fact that the DAX had an exceptionally good year with an annual return of 15.7%. Nevertheless, the leading German index, now with 40 members, was no match for the strong U.S. stocks.
The bar chart illustrates the striking dominance of the USA, in which many investors see a cluster risk. In fact, there has been a similar situation in the history of the MSCI World, where Japan dominated the index. Why the situation is completely different today and how the country weighting has developed over the last ten years in the MSCI ACWI can be found here.
Conclusion MSCI World 2021
- The MSCI World achieved an exceptionally strong annual gain of 21.0% in 2021.
- Due to rising inflation concerns, the index recorded a maximum drawdown of 5.6% from early September to early October.
- Despite the increasing uncertainties of the second year of the pandemic, the index behaved less volatile with a volatility of 11.3% than its historical average of 14.9%.
- In 2021, most U.S. tech stocks continued their strong performance. This enabled both the IT sector and the USA to further expand their already high weightings.
Coming soon is the annual review for the MSCI EM, in which we take a closer look at the performance of the emerging markets index.


Thx for this interesting analysis !
Can you please share on ur website the factsheets you collected ?
Hi Greg,
I got the data for the composition of the MSCI World from ishares. All the other data comes from MSCI directly. You can find the source here: https://en.guidingdata.com/financial-data/